
Emerging markets have seen an impressive run over the past few months, but how long should we expect that run to last?
Emerging markets have exploded higher over the past several months. The iShares MSCI Emerging Markets ETF (EEM) gained over 30% from the end of 2025 through June 22. The fund notched a sixth consecutive buy signal Monday at another new all-time high. We have seen that impressive appreciation outpace the Nasdaq-100 Index by over 10%, triple the return of the S&P 500 Index, and nearly quadruple the return of the iShares MSCI EAFE ETF (EFA) (through 6/22).
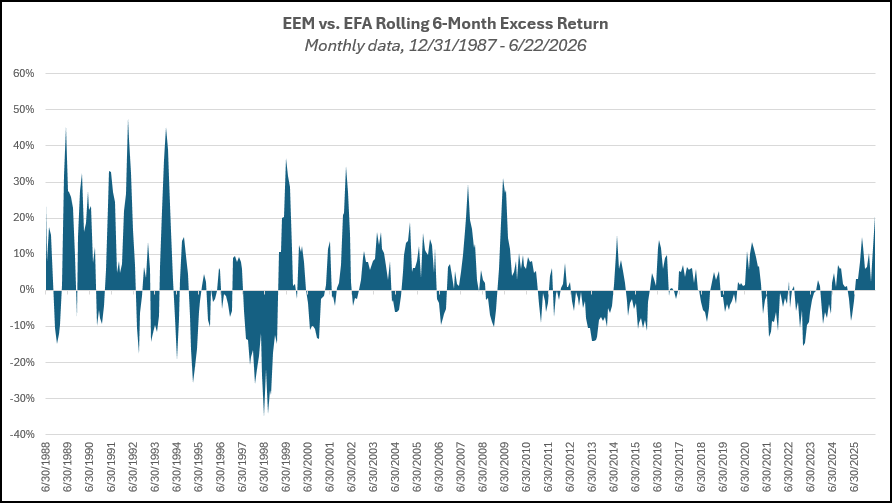
The difference in performance between emerging markets and developed markets has been stark. One way to measure this is by examining the rolling six-month return spread between EEM and EFA, which just breached the 20% mark for the first time in over 15 years. Looking at data back to 1987, there have been many other instances where we saw the spread get notably larger. If we continue to see outperformance through the end of June, we will have experienced 12 consecutive months of positive six-month excess returns in favor of EEM. There have been six other periods that saw longer environments favoring emerging markets, with the longest being a 22 month stretch that ended in December 2010. While the current run for emerging markets is the sharpest we have seen in more than 15 years, there is precedent for longer stretches of major divergence in the international equity space.
This strength has been one of the major reasons international equities remained at the top of the DALI rankings during the technology-led rebound in US equities. Looking underneath the hood at the emerging markets space reveals more similarities to US markets than we might expect. Over the past year, we have seen the electronic technology industry group, as classified by FactSet, go from just under 22% of the EEM portfolio to over 43% (through 6/22). Meanwhile, finance has dropped from 26% of the allocation to just over 20%. It should not come as a shock that this swap in exposure in the broad emerging markets benchmark has led to more growth than we have seen in years, like the concentration we have seen in US markets.

The technology allocation increase has been essentially focused on just three names; Taiwan Semiconductor Mfg Co (Taiwan) (TSM), Samsung Electronics (South Korea), and Hynix Semi (South Korea). TSM rose from about 10% of EEM to nearly 15% of the fund. Samsung went from about 2% to over 8%, and Hynix Semi went from 1.3% to nearly 8%. The allocation toward those three names expanded from roughly 13.6% to nearly 31% in the past year (through 6/22). This concentration leaves a major portion of capital invested in emerging markets concentrated in just a few names.

So, we have a major equity index that has seen rapid price appreciation due to sharp increases from a few names. Ring any bells? While the numbers behind these moves are unique, this feels like some of the movements we saw during the Magnificent 7 run over the past few years. Concentration does carry risk, but we have not seen that produce major drawdowns for US equities yet. In fact, we have seen most areas broaden out, with other names benefiting from AI-induced price appreciation while some Mag 7 names have been more stagnant.
With that said, we have certainly seen pullbacks, like we are experiencing on Tuesday (6/23). Most major AI-related names are down sharply intraday on Tuesday, including US and international representatives. The iShares MSCI Emerging Markets ETF is down over 5% at the time of this writing, which would mark the second time this month we saw an intraday drop of that magnitude (-6.5% on 6/5). Today’s drop marks the fourth 5% pullback so far in 2026. That is still lower than the annual average number of 5% pullbacks for EEM, which is just under five per year. Volatility is much more frequent in emerging markets, and we typically see many more 5% declines in the major EM benchmark than we are used to in US markets.
Volatility rarely feels good, especially when we see increased volatility in the strongest area of the strongest asset class across most of our rankings. However, increased volatility does not mean we are bound for weakness from emerging markets moving forward. We can overlay the annual price returns for EEM on the historical pullback counts to see if an increased frequency of pullbacks produces weaker years for EEM. In short, that does not seem to be the case. We do see more years of gains arise from years that show a lower-than-average pullback count, occurring in 14 out of the 39 years examined. However, we still see nine years with a higher-than-average pullback count that still resulted in positive years for EEM. This includes a four-year stretch from 2004 – 2007, and another two years from 2009 – 2010.

Tuesday’s drop led EEM to reverse down into a column of Os to $68, a simple three-box reversal from all-time highs. The fund still sits on multiple consecutive buy signals and is in a clearly defined positive trend. Based on the market action through Monday, EEM was nearing overbought territory at about 62% (north of 75% is typically the line for identifying extended names). The current pullback has led to an intraday OBOS reading of about 16%, at the time of this writing Tuesday, leaving the fund in a more actionable range if the decline stabilizes.
