The S&P 500 had one of its best rolling two-month performances in history ending on 5/29/2026. SPX gained 19.49% over that two-month span.
There has been a lot of, “this hasn’t happened since…” talk in the market recently. Technology and semiconductors continue to carry the market higher despite some concerning price action in other important areas of the market. Nonetheless, the S&P 500 had one of its best rolling two-month performances in history ending on 5/29/2026. SPX gained 19.49% over that two-month span. Since the S&P 500’s inception in 1957, there have been only nine other times performance has been better than 19.49% over a rolling two-month period (excluding clusters within 30 days). The forward returns are staggeringly strong with the average 1-month forward return north of 5%. Longer-dated timeframes are even better with the average 1-year and 2-year forward returns over 25%.
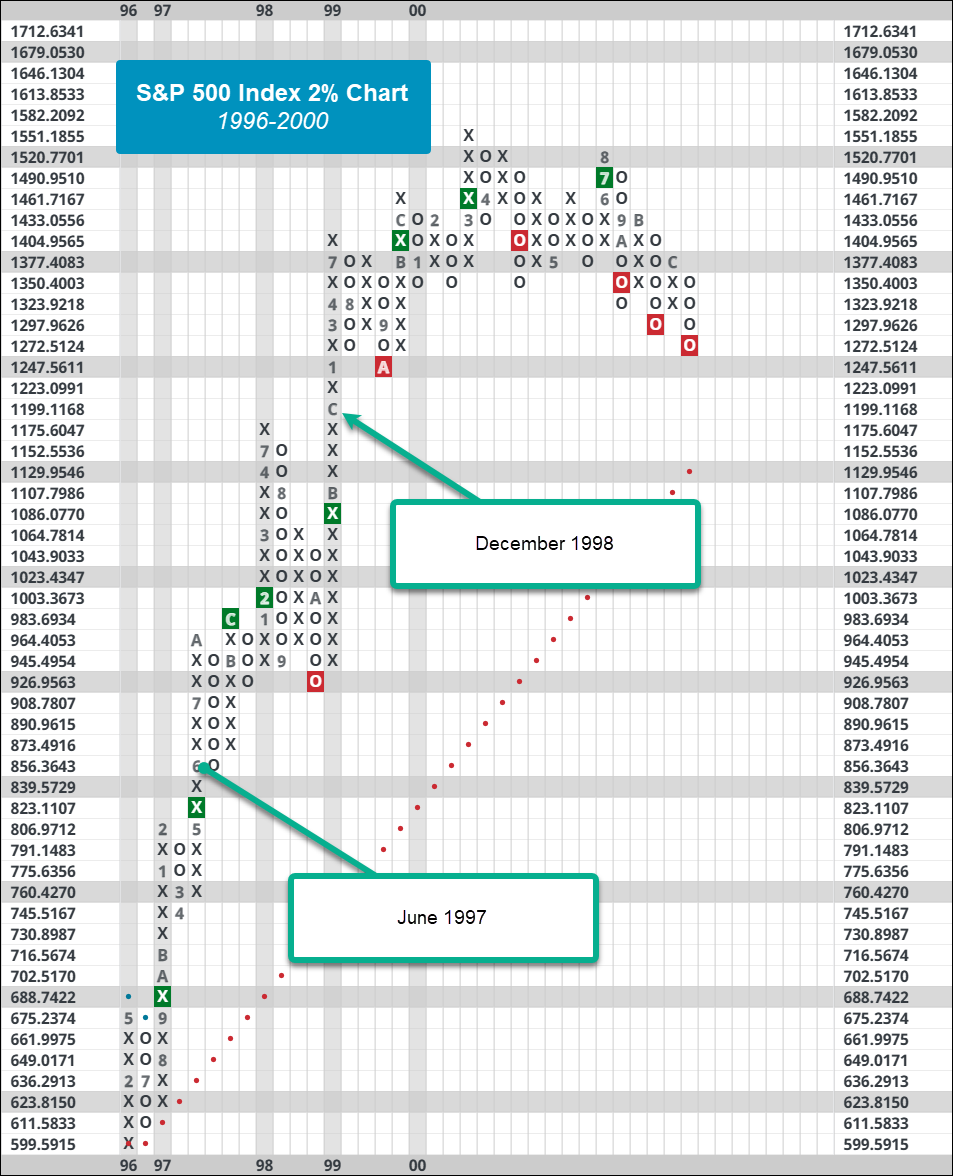
The market is usually only able to put together these sorts of runs in the short term near a major bottom event. While the recent rally started with the S&P 500 down just over 9% from its all-time high, that is the mildest drawdown from all-time highs on the day the two-month rally started. The only comparable period would be June 1997. A similar rally would take place late the next year, but the SPX was down almost 20% from all-time highs when that rally started, highlighting that the late 90s bull market had wild swings to the upside and downside. Some of the occurrences around major bottoms include early 1975, October 1982, May 2009, and May 2020. Interestingly, this is similar to the rally following the tariff tantrum last year, and that ended up boding well for the market as the S&P 500 is up over 25% over the last year.

Focusing on the trailing 1yr return column, usually the market had not been doing well over the prior year leading into such a strong two-month rally. This is slightly different than the percent from all-time high metric and can be used to add context to the market type at the time. This recent rally was only the second time that the trailing one-year return was positive with the only other time being 1997. That isn’t necessarily bearish either, the market still had another almost three years to run. Although, that is just one other occurrence, so it’s hard to look too much into it. Nonetheless, these face ripping rallies over the short-term tend to be pretty good for both short-term and long-term returns. While there are plenty of legitimate reasons to be worried right now, until we see price action weaken there is not much else to do except to party on.