Most Requested Symbols

Last Friday’s (5/29) trading led to a fifth consecutive buy signal for the iShares MSCI Emerging Markets ETF (EEM) and an all-time chart high for the time, before Monday’s (6/1) action brought the fund above $70 for the first time.
IPO interest seems to be heating up heading into the summer.
Weekly Rundown Video – May 27, 2026
Weekly rundown with NDW analyst team covering all major asset classes.
Weekly rundown with NDW analyst team covering all major asset classes.
Last Friday’s (5/29) trading led to a fifth consecutive buy signal for the iShares MSCI Emerging Markets ETF (EEM) and an all-time chart high for the time, before Monday’s (6/1) action brought the fund above $70 for the first time. This marks the sixth time the fund has given five consecutive buy signals, and the 25% gain through May for EEM is the sixth best start to a year since the fund’s inception and best since 2009.
From a relative strength and trending perspective, EEM has maintained positive long-term relative strength (RS buy signal) against the market as defined by the S&P 500 Equal Weight Index (SPXEWI) since September 2025 and a positive trend on its default trend chart since May 2025. This, along with the push to new highs, has brought the ETF up to a strong fund score of 5.71 (out of 6), just below its November 2025 high score mark (5.72) and to a fund score range not consistently maintained since the mid-2000s.
The rally to new highs has brought EEM, along with other emerging market funds into overbought territory with a Weekly OBOS (Overbought/Oversold) reading north of 90% - its highest reading since February and roughly in line with major U.S. equity indices, like the S&P 500 (SPX). For EEM though, a pullback to the mid $60s would be an actionable level for the ETF with initial support residing at $64, while longer-term support sitting in the mid to low $50s.

Along with EEM pushing to new highs, two notable country ETFs – the iShares MSCI Taiwan ETF (EWT) and iShares MSCI South Korea ETF (EWY) – also rallied to new highs during Monday’s (6/1) trading. EWT gave a fourth buy signal at $98 early last week to close out May before pushing to new highs above $100 in recent days, while EWY returned to a buy signal before similarly moving to new highs. Both ETFs have near perfect fund scores of 5.98 and 5.99 respectively, but their push to highs along with EEM and U.S. equity indices highlights a notable theme.
While semis and broader technology’s rally have influenced U.S. indices, they have similarly helped certain regions and countries within international equities. When examining the holdings of the Taiwan and South Korea ETFs the largest holdings are semiconductor stocks and other tech-related names like Taiwan Semiconductor, Hynix, and Samsung. Additionally, when looking at correlation coefficients for individual countries against the State Street Technology Select Sector SDPR Fund (XLK) and VanEck Semiconductor ETF (SMH), Taiwan (EWT) and South Korea (EWY) maintain among the highest positive correlations with tech, primarily semis, when examining long (10-years) and short-term (90 days) correlations among the broader lineup of iShares country and regional ETFs. Recent trading has only seen those correlations relative to semis and U.S. equities increase, highlighting the influence the semiconductors and broader AI-theme has had on the asset classes pushing to highs.
Similar to EEM, EWT and EWY reside in overbought territory, so those seeking to initiate or add to exposure are best served by looking for consolidation and a normalization of the 10-week trading band before considering. Initial support for EWT resides at $89, while support for EWY sits at $168.


Initial public offerings (IPOs) have come back into the spotlight in recent weeks. This is largely due to the pending IPO of SpaceX, which is currently slated to begin trading on the Nasdaq exchange next week. This company is historic for many reasons and has seen sky-high valuations ahead of its public listing. Many on Wall Street expect SpaceX to surpass $75 billion in fundraising from the public offering at a valuation of more than $1.5 trillion (source: reuters.com). That would nearly triple the record for largest fundraising through IPO, which is currently held by Saudi Aramco for the 2019 public offering that raised $25.6 billion (source: dealroom.net). The record for the largest fundraise from an American company is Visa, from all the way back in 2008, when they raised $17.9 billion. While the expectations for SpaceX might be on another planet when compared to previous US IPOs, it can be helpful to understand how other large companies performed following their public listing. The table below shows the largest 11 US companies by amount raised. Note that this list does not include companies headquartered overseas, even if they trade on US markets (no Saudi Aramco or Alibaba). We have also included forward returns ranging from seven days to two years for further perspective.

While this sample size is small, the trends are still clear. The first week after an IPO typically leads to positive price action for the new stock, with these large companies gaining 73% of the time. That positive hit rate drops off drastically, albeit with some major outliers, the further away you get from that IPO. Most IPOs come with a six-month lockup for shareholders that held company stock prior to the public offering, so it makes sense to have shares sell off once that threshold is hit. However, three of the five companies on our list that have been public for at least two years saw any initial losses turn into gains two years post-IPO.
Every market environment is different. Future IPOs are also playing on a different playing field than their predecessors due to recent adjustments to index-inclusion methodologies. We do not know how these adjustments will impact the price action for new IPOs like SpaceX or Anthropic (which also just filed for an IPO), however, attention around IPOs seems to be heating up.
There have been 152 IPOs already this year, looking at data through the end of May. IPOs are rarely consistent month-to-month, but if we did continue at that pace in the second half of the year, we’d be close to the pace of the 347 IPOs seen in 2025. This puts us in the average to above-average range for historical IPO counts going back through 2000.

(data through 5/31, source: stockanalysis.com)
The uptick in IPOs over the past year has coincided with positive price action from the Renaissance IPO ETF (IPO). According to Renaissance, this fund looks to maintain exposure to the largest, most liquid IPOs that have been listed for three years or less. The fund has rattled off four consecutive buy signals since March while ascending to a new multi-year high at $58 this week. IPO has a strong 5.79 fund score and a sharply positive score direction after showing near-term improvement on its market RS chart in April. While the technical picture is strong, the fund is in an extended position. We would not be surprised to see consolidation into the low $50s from the current position, or normalization over time as the trading band adjusts. Initial support is seen between $48.50 and $47.50.

Many of the largest holdings of this fund are technology players that have seen massive appreciation this year, including CoreWeave (CRWV), ARM Holdings (ARM), and Astera Labs (ALAB). While the technical pictures are favorable, those three stocks are in or near extended territory and are generally much more volatile than the market.
One of the larger holdings that has shown more consistent improvement is Viking Holdings Ltd (VIK). This stock has a 4 for 5 TA rating and has been in a positive trend since April. We saw the stock move to an RS buy signal against the market in July 2025 and it sits in the top decile of the leisure sector matrix, all indicative of the favorable long-term technical picture. The recent price action saw VIK notch a new all-time high at $93 before pulling back to the current position at $90 this week, initiating a buy-on-pullback opportunity. Initial support is seen from $81 to $75.

Average Level
31.79
| < - -100 | -100 - -80 | -80 - -60 | -60 - -40 | -40 - -20 | -20 - 0 | 0 - 20 | 20 - 40 | 40 - 60 | 60 - 80 | 80 - 100 | 100 - > |
|---|---|---|---|---|---|---|---|---|---|---|---|
|
Sell signalagg
|
|||||||||||
|
Buy signalfxe
|
|||||||||||
|
Sell signaltlt
|
Sell signallqd
|
Buy signalVOOV
|
|||||||||
|
Buy signalGSG
|
Sell signaldx/y
|
Buy signaliwm
|
Buy signalEEM
|
Buy signalONEQ
|
|||||||
|
Sell signalief
|
Buy signalhyg
|
Buy signalicf
|
Buy signalGCC
|
Buy signalijr
|
Buy signalrsp
|
Buy signalXLG
|
Buy signalVOOG
|
||||
|
Sell signalshy
|
Sell signalgld
|
Sell signaluso
|
Buy signaldvy
|
Buy signalefa
|
Buy signalIJH
|
Buy signaldia
|
Buy signalSPY
|
Buy signalQQQ
|
|||
| < - -100 | -100 - -80 | -80 - -60 | -60 - -40 | -40 - -20 | -20 - 0 | 0 - 20 | 20 - 40 | 40 - 60 | 60 - 80 | 80 - 100 | 100 - > |
| AGG | iShares US Core Bond ETF |
| USO | United States Oil Fund |
| DIA | SPDR Dow Jones Industrial Average ETF |
| DVY | iShares Dow Jones Select Dividend Index ETF |
| DX/Y | NYCE U.S.Dollar Index Spot |
| EFA | iShares MSCI EAFE ETF |
| FXE | Invesco CurrencyShares Euro Trust |
| GLD | SPDR Gold Trust |
| GSG | iShares S&P GSCI Commodity-Indexed Trust |
| HYG | iShares iBoxx $ High Yield Corporate Bond ETF |
| ICF | iShares Cohen & Steers Realty ETF |
| IEF | iShares Barclays 7-10 Yr. Tres. Bond ETF |
| LQD | iShares iBoxx $ Investment Grade Corp. Bond ETF |
| IJH | iShares S&P 400 MidCap Index Fund |
| ONEQ | Fidelity Nasdaq Composite Index Track |
| QQQ | Invesco QQQ Trust |
| RSP | Invesco S&P 500 Equal Weight ETF |
| IWM | iShares Russell 2000 Index ETF |
| SHY | iShares Barclays 1-3 Year Tres. Bond ETF |
| IJR | iShares S&P 600 SmallCap Index Fund |
| SPY | SPDR S&P 500 Index ETF Trust |
| TLT | iShares Barclays 20+ Year Treasury Bond ETF |
| GCC | WisdomTree Continuous Commodity Index Fund |
| VOOG | Vanguard S&P 500 Growth ETF |
| VOOV | Vanguard S&P 500 Value ETF |
| EEM | iShares MSCI Emerging Markets ETF |
| XLG | Invesco S&P 500 Top 50 ETF |

| Symbol | Company | Sector | Current Price | Action Price | Target | Stop | Notes |
|---|---|---|---|---|---|---|---|
| BPOP | Popular, Inc. | Banks | $147.81 | hi 130s - low 150s | 200 | 120 | 5 for 5'er, 18 of 174 in favored BANK sector matrix, LT pos peer & mkt RS, triple top, good R-R, 2% yield |
| GRMN | Garmin Ltd. | Leisure | $236.80 | mid 230s - mid 260s | 364 | 196 | 5 TA rating, LT pos trend and mkt RS buy, top 33% of LEIS sector matrix, buy-on-pullback |
| OSW | OneSpaWorld Holdings Ltd. | Leisure | $23.81 | 22 - 24 | 30.50 | 19 | 5 for 5'er, top half of LEIS sector matrix, LT pos peer & mkt RS, spread quintuple top |
| SKT | Tanger Inc. | Real Estate | $35.42 | mid-to-hi 30s | 48 | 31 | 5 for 5'er, top 25% of REAL sector matrix, LT pos peer & mkt RS, R-R~2.0, 3.2% yield |
| IBOC | International Bancshares Corporation | Banks | $70.92 | low-to-mid 70s | 93 | 63 | 4 for 5'er, favored BANK sector, LT pos peer & mkt RS, bearish signal reversal, R-R~2.0, 1.95% yield |
| MSGE | Madison Square Garden Entertainment Corp. | Leisure | $72.35 | 63 to 69 | 98 | 53 | 5 for 5'er since Nov. 2025; Top Decile of Leisure Matrix; Pos. Trend since May 2025; ATH 5/7. |
| LYV | Live Nation Entertainment Inc. | Leisure | $170.45 | low 160s to mid 170s | 202 | 142 | 4 for 5'er; Pos. Trend; Top Half of Leisure Matrix; Within one box of ATH. |
| MO | Altria Group Inc. | Food Beverages/Soap | $68.65 | low-to-mid 70s | 91 | 62 | 4 for 5'er, top quartile of FOOD sector matrix, one box from RS buy, bullish triangle, 5.9% yield |
| MPC | Marathon Petroleum Corp. | Oil Service | $258.66 | 240 - 260 | 360 | 208 | 4 for 5'er, pos. trend, top third of Oil Services matrix, pos. L-T Mkt and Peer RS. |
| VLO | Valero Energy Corp | Oil Service | $252.52 | mid 230s - hi 250s | 328 | 212 | 4 TA rating, top 50% of OILS sector matrix, LT pos trend, buy-on-pullback |
| C | Citigroup, Inc. | Banks | $129.09 | low 120s - low 130s | 188 | 102 | 5 for 5'er since July '25; top decile of Banks matrix; pos. trend since May '25. |
| AMAT | Applied Materials, Inc. | Semiconductors | $458.17 | 420s - low 450s | 576 | 376 | 4 for 5'er, favored SEMI sector matrix, LT pos peer & mkt RS, shakeout --> triple top, good R-R |
| CTRE | CareTrust REIT Inc | Real Estate | $39.34 | $38 - $43 | 62.50 | 34 | 5/5'er since Apr. '25, top quintile of Real Estate Matrix, pos. trend and buy signal since Jul. '23. |
| TT | Trane Technologies PLC | Building | $448.47 | 420s - 470s | 652 | 380 | 5 TA rating, LT pos trend and mkt RS buy, top 50% of Building sector matrix, buy-on-pullback |
| BTI | British American Tobacco Sp-Adr (United Kingdom) ADR | Food Beverages/Soap | $61.00 | hi 50s - low 60s | 92 | 51 | 4 for 5'er, top 25% of FOOD sector matrix, one box from mkt RS buy, buy on pullback, R-R~3.0, 5.3% yield |
| LAMR | Lamar Advertising Company | Media | $150.47 | mid 140 to mid 150 | 228 | 122 | 5 for 5'er, top third of Media Matrix, pos. trend, Reward-Risk > 11, current yield > 4%. |
| Symbol | Company | Sector | Current Price | Action Price | Target | Stop | Notes |
|---|
| Comment | |||||||
|---|---|---|---|---|---|---|---|
|
|
|||||||
LAMR Lamar Advertising Company R ($150.91) - Media - LAMR has been at least a 3 technical attribute stock since July 2021and has maintained a 5 for 5’er for more than a month. LAMR has shown long-term positive relative strength against the market since May 2020 and its peer group since July 2021, while currently ranking within the top third of the Media sector matrix. On the trend chart, LAMR returned to a buy signal and shifted the trend back to positive in April before pushing to a new high at $158 in early May. After pulling back to the mid $140s, LAMR reversed back into Xs to the mid $150s in the latter stages of May. Okay to consider the stock in the upper $140 to mid $150 range. The bullish price objective of $228 will act as our price target, and we’ll utilize $122 as our stop loss point, which would violate the bullish support line and support dating to January.
| 26 | |||||||||||||||||||||||||||||
| 158.00 | X | 158.00 | |||||||||||||||||||||||||||
| 156.00 | X | O | 156.00 | ||||||||||||||||||||||||||
| 154.00 | X | O | X | 154.00 | |||||||||||||||||||||||||
| 152.00 | X | O | X | 152.00 | |||||||||||||||||||||||||
| 150.00 | X | O | X | 150.00 | |||||||||||||||||||||||||
| 148.00 | X | O | X | 148.00 | |||||||||||||||||||||||||
| 146.00 | X | O | 146.00 | ||||||||||||||||||||||||||
| 144.00 | X | 144.00 | |||||||||||||||||||||||||||
| 142.00 | X | 142.00 | |||||||||||||||||||||||||||
| 140.00 | • | 5 | 140.00 | ||||||||||||||||||||||||||
| 138.00 | X | • | X | Mid | 138.00 | ||||||||||||||||||||||||
| 136.00 | X | X | O | • | X | 136.00 | |||||||||||||||||||||||
| 134.00 | X | X | X | O | X | O | • | X | 134.00 | ||||||||||||||||||||
| 132.00 | X | O | X | O | X | O | X | 3 | X | 132.00 | |||||||||||||||||||
| 130.00 | • | X | O | X | O | X | O | X | O | X | 4 | 130.00 | |||||||||||||||||
| 128.00 | X | • | • | X | X | C | X | O | X | O | • | O | X | O | X | • | 128.00 | ||||||||||||
| 126.00 | X | O | X | • | X | O | X | O | X | 2 | • | O | X | O | X | • | 126.00 | ||||||||||||
| 124.00 | 7 | O | X | O | X | O | X | 1 | • | O | O | • | 124.00 | ||||||||||||||||
| 122.00 | 6 | O | X | O | X | 9 | B | • | • | 122.00 | |||||||||||||||||||
| 120.00 | X | X | 8 | O | X | A | X | • | 120.00 | ||||||||||||||||||||
| 118.00 | • | X | X | O | X | • | O | X | O | X | • | Bot | 118.00 | ||||||||||||||||
| 116.00 | • | 5 | O | X | O | X | • | O | X | O | • | 116.00 | |||||||||||||||||
| 114.00 | X | • | X | O | X | O | • | O | • | • | 114.00 | ||||||||||||||||||
| 112.00 | O | X | O | X | O | • | • | 112.00 | |||||||||||||||||||||
| 110.00 | O | X | O | X | • | 110.00 | |||||||||||||||||||||||
| 108.00 | O | O | X | • | 108.00 | ||||||||||||||||||||||||
| 106.00 | O | • | 106.00 | ||||||||||||||||||||||||||
| 26 |
| DINO HF Sinclair Corporation ($73.56) - Oil Service - DINO returned to a buy signal Tuesday when it broke a double top at $73, Tuesday's move adds to an already positive technical picture as DINO is a 4 for 5'er that ranks in the top quintile of the oil service sector matrix. From here, the stock faces overhead resistance at $74. Meanwhile, support can be found at $67. |
| GILD Gilead Sciences, Inc. ($128.28) - Biomedics/Genetics - GILD moved lower to complete a triple bottom break at $128, marking its third consecutive sell signal. The 2 for 5'er moved down from a 3 after reversing back into a negative trend with its latest move. Additionally, the stock ranks in the bottom half of the biomedics/genetics sector matrix. A sell can be considered here. Initial strong resistance is at $136, with additional resistance at $142. |
| JCI Johnson Controls International PLC ($141.71) - Building - JCI reversed into Xs and broke a double top at $142 to return to a buy signal. The stock is a 4 for 5'er that ranks within the top quartile of the Building sector matrix. Okay to consider here on the breakout. Note resistance in the mid $140s. Initial support lies at $132, while additional sits at $126. |
| NFLX NetFlix Inc. ($83.60) - Media - NFLX has been a tough one for trendfollowers so far this year, as the name posts its third consecutive sell signal on its default chart with action on 6/2. With the move, NFLX will return back to a negative trend, pushing it back into unfavorable territory for now. With hindsight as a guide, the first negative development should have come when the name was unable to get back towards those highs established earlier in 2025 after braking back into a positive trend. All that to say, be very cautious with exposure to NFLX for now. With price action leaving the media giant at levels from the start of last year. |
| V Visa Inc. ($317.03) - Finance - V shares moved lower today to break a double bottom at $316 to mark its first sell signal. This 3 for 5'er has been in a positive trend since April and on an RS buy signal versus the market since November 2012. V shares are trading at the middle of their ten-week trading band. From here, support is offered at $296. |
| WFRD Weatherford International Plc ($104.00) - Oil Service - WFRD gave an initial sell signal Tuesday when it broke a double bottom at $100. The outlook for the stock remains modestly positive, however, as WFRD is a 3 for 5'er. From here, the next level of support sits at $98. |

The option suggestions featured here are pulled from the NDW Options Ideas tool. These are just a sample of the ideas that can be found there. The Options Idea tool contains numerous additional income and speculative plays. It also offers relative strength-based screens targeting the highest (and lowest) relative strength stocks and ETFs that have recently moved counter to their longer-term trend. To access or subscribe to the Options Ideas tool click here.
Call
FedEx Corporation (FDX) September 18 $320 Call
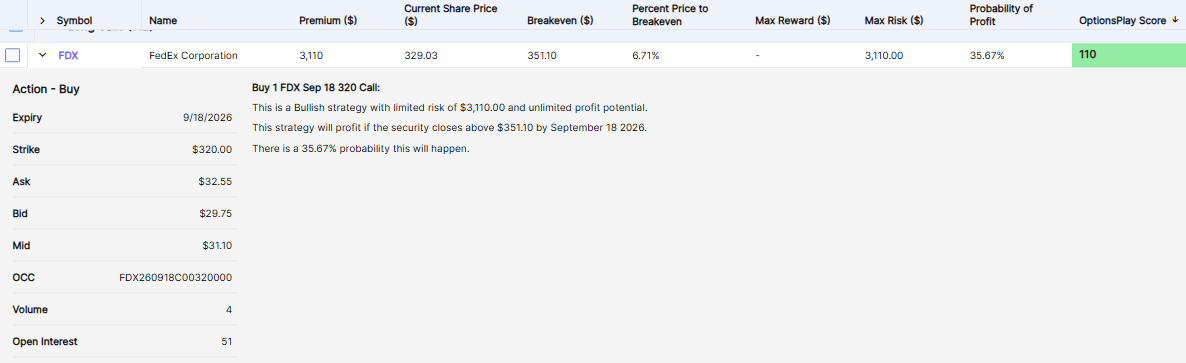
| Additional Data: | |
| Bid/Ask Spread | 9.41% |
| Delta | 61.71 |
| Gamma | 0.61 |
| Implied Volatility | 76.53% |
| Expiry Days | 108 |
| Earnings Date | 6/23/2026 |
Put
McDonald's Corporation (MCD) Aug 21 $280 Put

| Additional Data: | |
| Bid/Ask Spread | 4.47% |
| Delta | -52.91 |
| Gamma | 1.47 |
| Implied Volatility | 23.06% |
| Expiry Days | 80 |
| Earnings Date | 8/6/2026 |
Income (Short Put)
General Motors (GM) July 2 $76 Put

| Additional Data: | |
| Ann. Static Return | 25.70% |
| Bid/Ask Spread | 27.34% |
| Delta | 25.99 |
| Gamma | -3.7 |
| Implied Volatility | 33.59% |
| Expiry Days | 30 |
| Earnings Date | 7/21/2026 |
Daily Equity & Market Analysis
Loading, Please Wait...
