Today we update our report on the "failed breakout" pattern, where a stock fails to sustain price action above a critical level of old resistance after breaking into a positive trend. We also uncover several stocks that might be at risk of breakdowns despite recent upward movement.
To open the year, our team did a deeper dive into this idea of “consistency” on any asset’s individual PnF chart. In this case, we studied the idea of avoiding “failed breakouts”, defined by a stock moving back into a positive trend but ultimately falling back lower. More often than not, these failed breakouts came on the back of the stock showing a distinct inability to sustain price action at or above a distinguished previous high, tipping off the astute analyst that the trend break might not be all that convincing. The full article is linked here, for those of you who want a more detailed definition of a “failed breakout” (or maybe just want to check out the “mystery” failed breakout at the end). Today’s feature will discuss some follow-up of our previously flagged failed breakouts, as well as provide a handful of assets that currently exhibit similar technical pictures as we move into June.
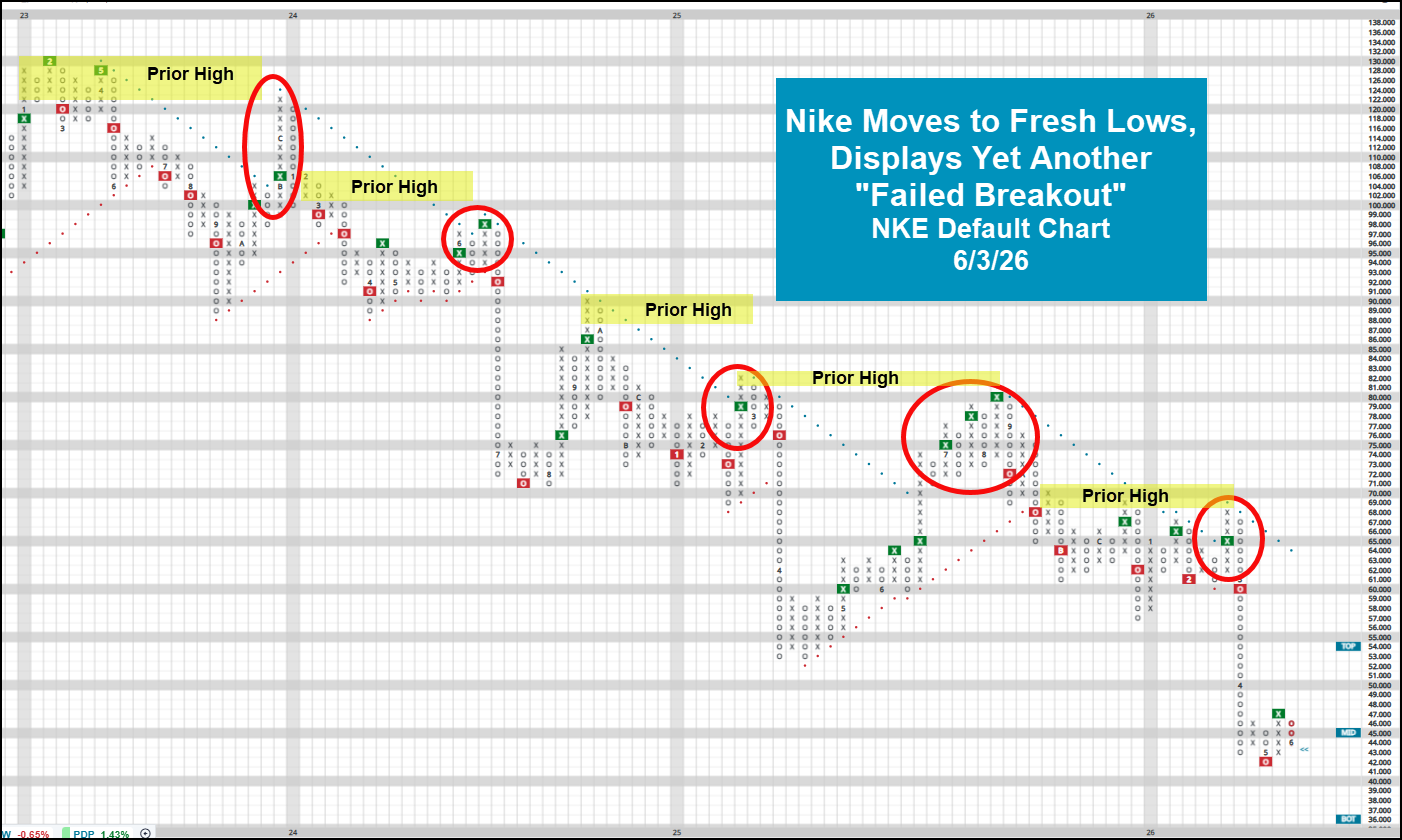
The genesis for this entire study in January arose when Nike (the poster child of “failed breakouts”) neared a test of its negative trend line back in January. Around the office, the analyst team then discussed/observed how infrequently the last few trend breaks led to further upside for NKE as it often failed to advance pasted a point of old resistance, commenting that even a positive trend break wouldn’t be enough to “convince” most of us that the stock had turned a new leaf. From there, we started looking at other charts that showed similar pictures over time to see if any patterns emerged. Chipotle Mexican Grill (CMG) (2025), Exxon Mobil (XOM) (2016-2019), Caterpillar (CAT) (2018-2020), UnitedHealth Group (UNH) (2025), and Meta Platforms (META) (2021-2022) all had markings consistent with a “failed breakout” at the time. Even larger indices aren’t immune, seeing the likes of SPX, RUT, etc. display their fair share of examples over the years. Fast forward to 6/3, it turns out that NKE did in fact manage to return back to a positive trend back in February…. Only to quickly turn around move to new lows like clockwork. The chart of NKE below helps provide a visual representation of these failed breakouts over time, for those of you still trying to grasp what exactly these charts look like in practice.
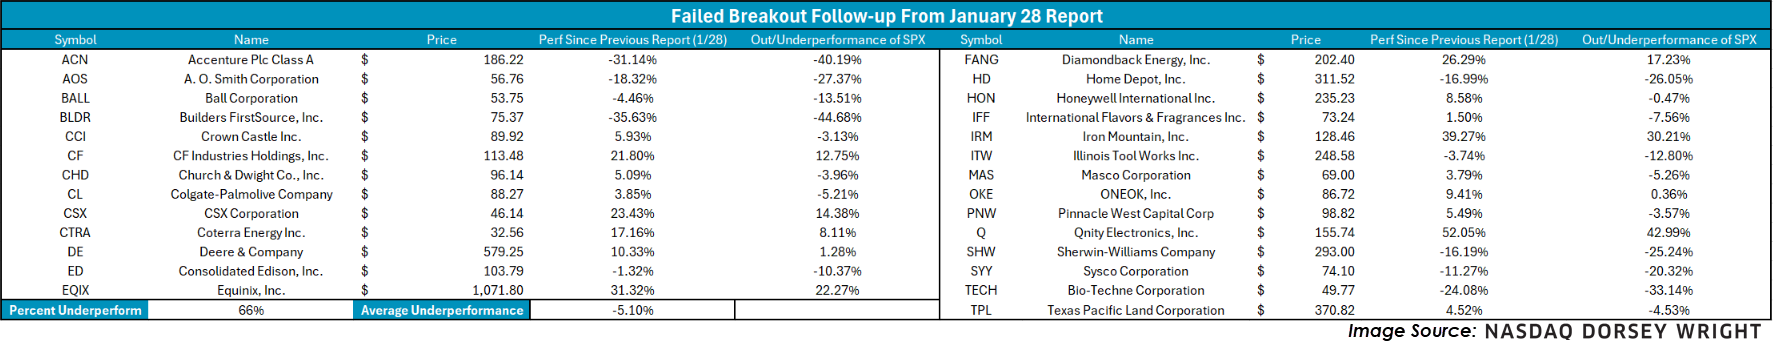
This certainly wont be the case every time…. There are undoubtedly a whole host of trend breaks that are in fact the start of a more defined uptrend, but an asset being able to break past previous highs (in addition to the trend break) seems to be important for setting the “tone” of the new break. The table below breaks down performance since 1/28 for the 27 previous members of our “possible failed breakout” screen described in our prior report. 66% of the names detailed in the report have underperformed the broader S&P 500 over the last few months, by an average of 5.10%. There are, of course, trends that did end up working out (see IRM, which has turned into a perfect 5/5’er) but the wide majority of names continue to exhibit technical weakness.
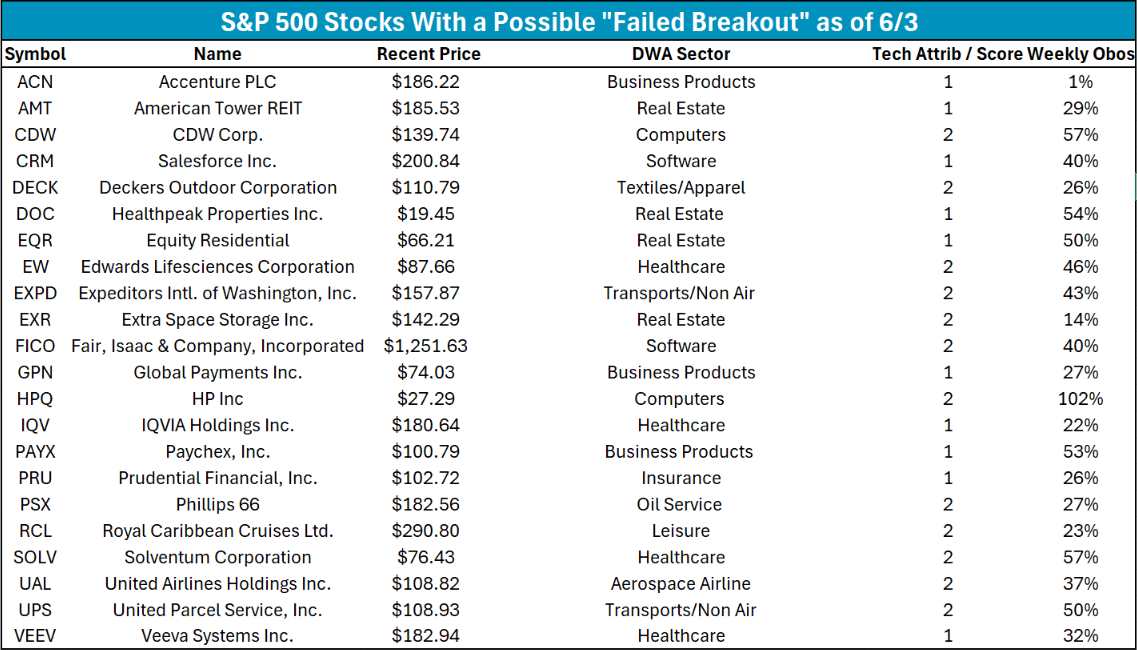
Of course, most of you don’t particularly care about the failed breakouts from 6 months ago… but more so what S&P 500 names are worth watching for possible false breakouts as we wrap up Q2. Anecdotally, these names could be hit quite hard if broader markets decide to roll over into the back half of the year, so knowing which options might be on thin ice could be important as you “pull the weeds” in your portfolio. Utilizing a similar screen to that from our 1/28 report, we can identify 22 S&P 500 stocks that have similar technical pictures to those that might flag as a “failed breakout” at the time of this writing. Consider fishing from this pond if you’re looking for some short ideas on breakdowns… or maybe take this as a “buyer beware” if you currently have exposure to these names.
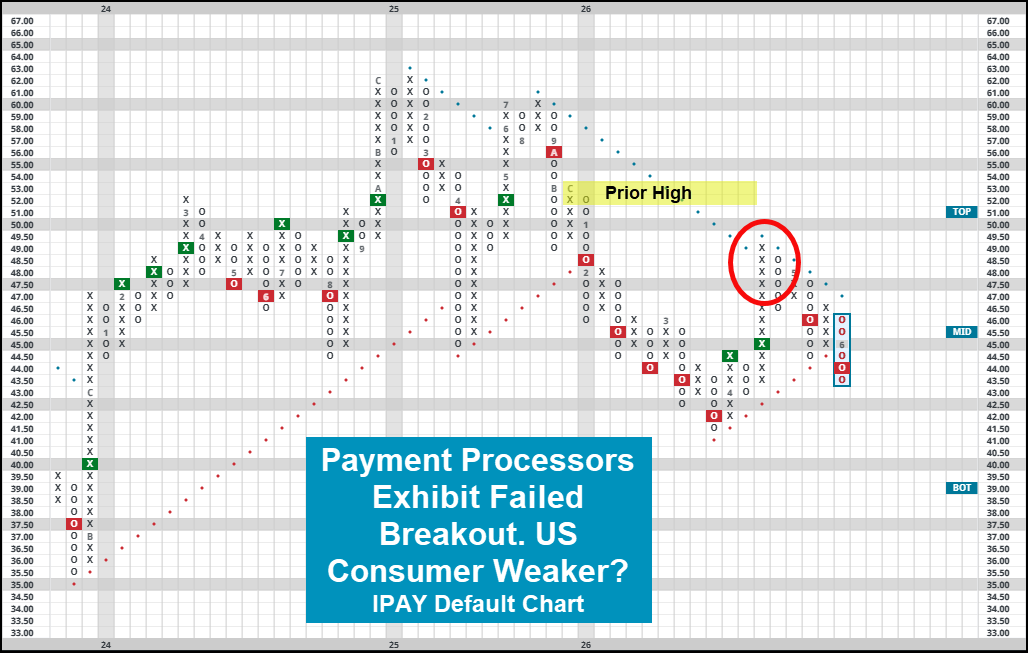
We will wrap up today’s commentary with a final word on two other areas that recently exhibited failed breakouts. Bitcoin representative IBIT has moved swiftly back towards 2026 lows after failing to sustain price action around recent highs from the back half of 2025, recently returning back to a negative trend over the last few days. The outlook for bitcoin (or the broader crypto space for that matter) remains bleak as we wrap up Q2. Payment processors, evidenced by ETF IPAY (below) have also moved lower recently, falling back into a negative trend with action on 6/3. The fund has put in a series of lower tops since its 2025 highs, and the failure to sustain action in the upper $40 range confirms the idea that the space has weakened materially. There are certainly comments (outside the scope of this update) on what a weaker payment processor means for the health of the US consumer, but we won’t touch on that here. Remember, when used in tandem with other tools on the platform, like the technical attribute/fund scoring system, noticing important points of support can help you identify which stocks might actually be breaking out…. And which are just a wolf in sheep’s clothing.