April was a fantastic month for equity markets. The Invesco QQQ Trust ([QQQ]) had its best calendar month since October 2002 with a gain of 15.69%.
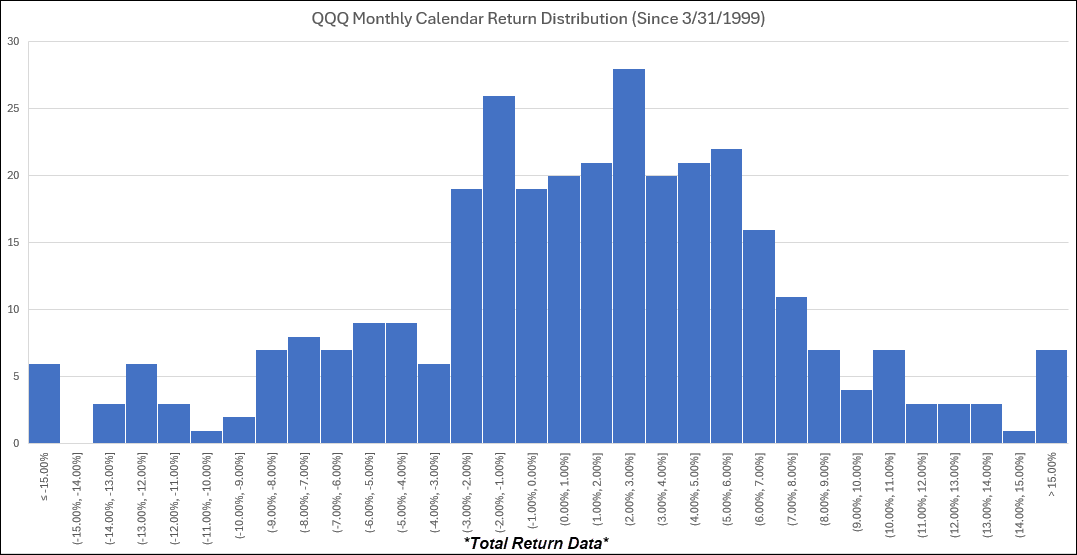
April was a fantastic month for equity markets. The Invesco QQQ Trust (QQQ) had its best calendar month since October 2002 with a gain of 15.69%. The rally comes following four negative months over the prior six months for QQQ. While it was an uneasy few months for the tech-heavy index, it gave the index time to build up enough energy for a major push higher. The combination of high volatility heading into April, multi-month consolidation, and earnings season was the perfect recipe for a rally if enough fear came out of the market. The feat is more spectacular given the mature nature of the Nasdaq-100 Index as compared to the other six times (1999-2002) it was able to gain +15% in a calendar month. The table below shows the frequency of monthly calendar returns with April breaking a tie between positive and negative 15% months. However, the return distribution is still negatively skewed as the average monthly return is less than the median monthly return for QQQ. On the bright side, the average and median returns are 1.07% and 1.45%, respectively, and nearly half of the calendar months since March 1999 have had a return of 2% or greater. In fact, the 2%-3% bucket is the most frequent monthly return for QQQ with a count of 28 months.
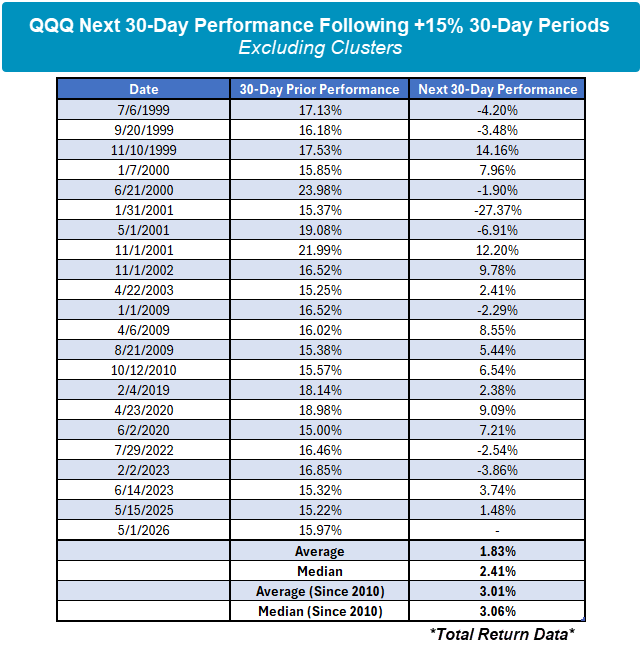
April’s historic return was clearly helped by timing as the market bottomed out on the last day of March. On a rolling 30-day basis, there have been many more +15% periods, even when excluding clusters. QQQ has been able to put together a handful of +15% 30-day periods just this decade whereas it happened only twice in the 2010s. For investors, there are natural concerns that arise following such a strong run in a short time. What goes up, must come down, right? Well, that’s not always the case. We see average and median returns over the next 30 days tend to also be strong at 1.83% and 2.41%, respectively. The next 30-day returns have been even better looking at data just since 2010 with average and median returns north of 3%. There are of course a few negative instances in the data set, but overall, these positive outlier periods tend to be a good sign over the next 30 days.