Most Requested Symbols

May marks the second seasonal evaluations for the Fund Score Method (FSM) models. As we do during each evaluation season, we will cover the trades and themes to get insights into any shifts in market leadership. Whether or not one follows any of the FSM models, their evaluations give us important information.
The seasonal market transition is a great time to evaluate your existing portfolio allocation. Today, we offer an idea that capitalizes on seasonal tendencies while maintaining a momentum focus at all times.
Weekly Rundown Video – April 29, 2026
Weekly rundown with NDW analyst team covering all major asset classes.
Weekly rundown with NDW analyst team covering all major asset classes.
May marks the second seasonal evaluations for the Fund Score Method (FSM) models. If you’re not familiar with the FSM model framework, a large majority of the models evaluate their holdings on a seasonal quarter basis with February, May, August, and November marking the start/end of each seasonal quarter. Each FSM model is built around a universe of ETFs or mutual funds with the highest scoring funds selected at each evaluation. If you want a deeper dive into the basics for FSM models, check out our Fund Score Method Model Guide. As we do during each evaluation season, we will cover the trades and themes to get insights into any shifts in market leadership. Whether or not one follows any of the FSM models, their evaluations give us important information.
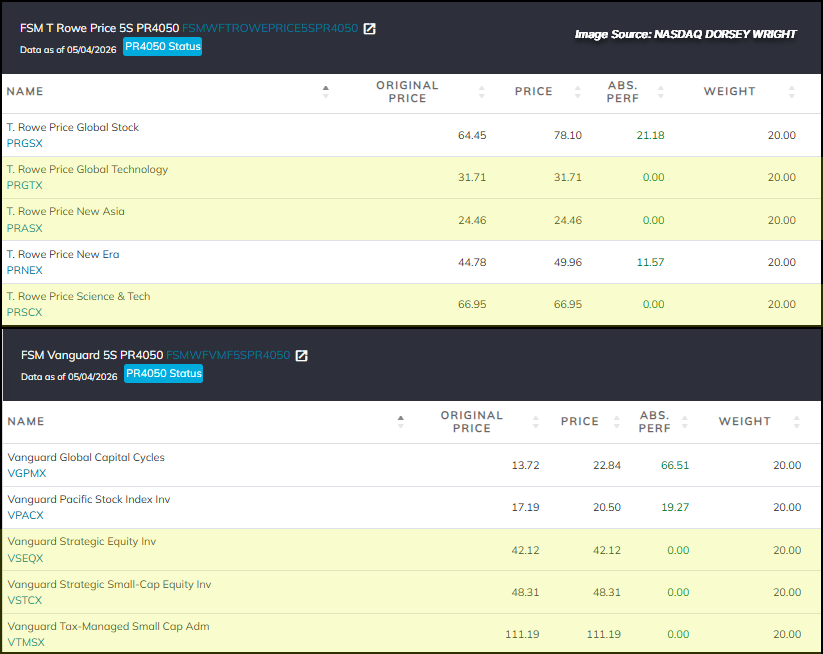
The major theme during the most recent evaluation for the FSM models witnessed a shift from models maintaining a notable overweight toward international equities to U.S. equity exposure. In some cases, the FSM models have seen their allocations go from entirely within international funds to more equal mix of international and domestic equities with slight overweight to one asset class present within certain strategies, depending on model universe makeup. The prime example of such shift comes from the T Rowe Price 5S PR4050 Model, which saw the removal of the Spectrum International (PSICX), International Value (TRIGX), and Overseas Stock (TROSX) funds, and the additions of New Asia (PRASX), Global Technology (PRGTX), and Science & Technology (PRSCX) funds. While the naming of the funds may signal more of an overweight toward international equities, the T Rowe Price 5S PR4050 Model’s underlying allocation of the individual stocks reveals a slight overweight toward U.S. equities, primarily within technology and energy.
The Vanguard 5S PR4050 Model witnessed a similar shift in asset allocation, but with a slight twist, as it removed the European Stock (VEURX), Developed Markets (VDVIX), and International Stock (VGTSX) funds and added the Tax-Managed Small Cap (VTMSX), Strategic Equity (VSEQX), and Strategic Small Cap (VSTCX). The addition of small caps brings the model to overweight U.S. equities along with exposure to the Pacific Stock (VPACX) and Global Capital Cycles (VGPMX) funds.
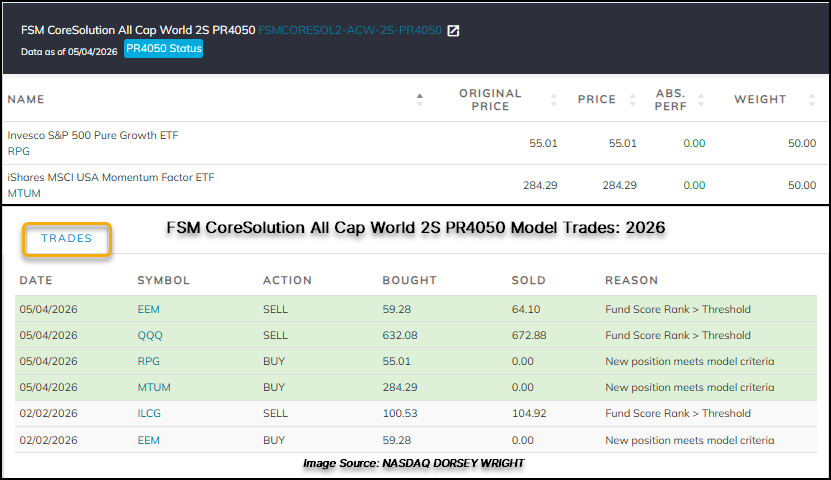
Within the CoreSolution lineup of FSM models, the FSM CoreSolution All Cap World 2S PR4050 followed the overall theme for the quarter – removing international and bringing in domestic exposure - and saw a complete turnover within the model. This seasonal quarter evaluation witnessed the removal of both the Invesco QQQ Trust (QQQ) and the iShares MSCI Emerging Markets ETF (EEM), while seeing the additions of the iShares MSCI USA Momentum Factor ETF (MTUM) and Invesco S&P 500 Pure Growth ETF (RPG). Along with the All Cap World 2S PR4050 Model removing QQQ, the FSM CoreSolution U.S. Core 2S PR4050 also removed the ETF while adding the SPDR S&P 500 Trust (SPY) in its place.
Though the notable theme for the quarter saw a shift from portfolios potentially overweight or entirely within international equities to either a more equal mix of international and domestic or slightly overweight toward domestic, the recent changes highlight both asset classes continuing to show superior trending and relative strength characteristics highlights the strength within the risk-on assets versus commodities and defensive assets.

As of the close last Thursday (10/31), we ended the seasonally strong period and officially moved into the weak season of the market (May 1 – October 31). This year, in the “seasonally strong” period, the S&P 500 (SPX), Dow (.DJIA), and Nasdaq (NASD) each gained between 4% and 5.5%. Each of these major market benchmarks would have been in the red for that stretch were it not for the sharp rebounds seen in April. This marked the second straight year that the “strong” period underperformed the “weak” period immediately preceding it.
However, it isn’t easy to know when the market will buck a historical trend, and this is one of the reasons why we've put forth the concept of a seasonal "tilting" approach that employs factor investing. This is a way to incorporate a long-term, well-documented bias in the market, without resorting to an “all in or all out” strategy that many investors may find unpalatable. This strategy also offers an opportunity to further differentiate yourself within the wealth management space as an expert on investment factors.
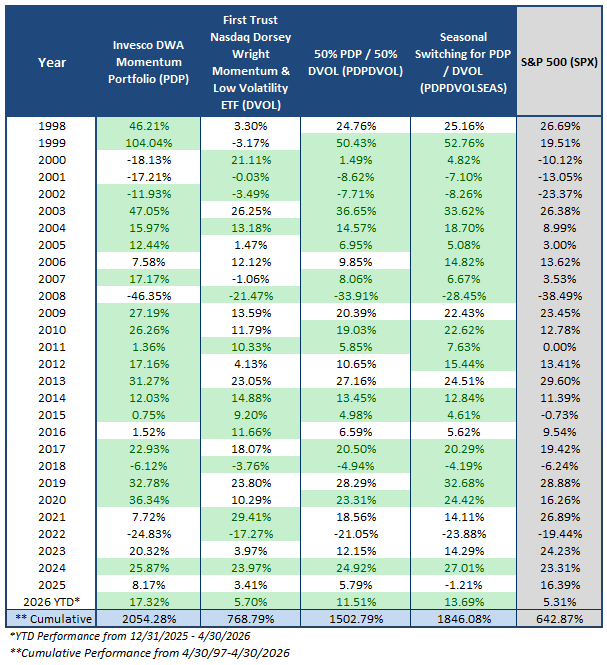
Today, we will evaluate one of the seasonal portfolios that combines two momentum approaches while incorporating low volatility to ideally smooth out the ride over time. This is done by tactically shifting a portfolio's emphasis between the Invesco Nasdaq Dorsey Wright Momentum ETF (PDP) and the First Trust Nasdaq Dorsey Wright Momentum & Low Volatility ETF (DVOL) depending on the accompanying seasonal period. Since PDP is solely focused on momentum, it is the overweight fund during the “strong” seasonal period from November through April (70% PDP, 30% DVOL). The allocation then shifts to overweight DVOL during the “weak” seasonal period to provide more exposure to low volatility names (70% DVOL, 30% PDP). Even though both strategies focus on high momentum names, the low volatility screen used in DVOL has historically led to notable allocation differences. Combining the two approaches makes for an attractive US "core" equity solution.
This strategy is available under our Models page for platform subscribers to set alerts. Even though there will only be two trades a year, the website model can help with additional perspective or collateral needed before incorporating the strategy into your process. Remember, the point of any strategy won’t be (and shouldn’t be) to outperform every single year, but to create an all-weather portfolio that is systematic and defendable across various market environments.
The table below shows the annual returns for each of the strategies, incorporating back-tested data prior to the launch of each fund. We also include some notable observations on the returns over the years.
Key Observations:
Disclosures:
Invesco Nasdaq Dorsey Wright Momentum ETF (PDP): https://www.invesco.com/us/en/financial-products/etfs/invesco-dorsey-wright-momentum-etf.html
First Trust Dorsey Wright Momentum & Low Volatility ETF (DVOL): https://www.ftportfolios.com/retail/etf/etfsummary.aspx?Ticker=DVOL
Performance prior to each funds’ inception date are back-tested and based upon the underlying index shown below:
Inception date of PDP is 3/1/2007, prior to that all testing is based on backtested strategy information available on the Dorsey Wright platform.
Inception date of DVOL is 9/5/2018, prior to that all testing is based on backtested strategy information available on the Dorsey Wright platform.
Returns for all models and benchmarks are Pure Price Returns, excluding dividends and transaction costs. Returns within the model portfolios are a result of back-testing. Back-tested performance is hypothetical and is provided for informational purposes to illustrate the effects of the strategy during a specific period. The hypothetical returns have been developed and tested by NDW, but have not been verified by any third party and are unaudited. Back-testing performance differs from actual performance because it is achieved through retroactive application of a model investment methodology designed with the benefit of hindsight.
Model performance data (both back-tested and live) does not represent the impact of material economic and market factors might have on an investment advisor’s decision-making process if the advisor were actually managing client money. Investors cannot invest directly in an index. Indexes have no fees. Past performance is not indicative of future results. Potential for profits is accompanied by possibility of loss.
The relative strength strategy is NOT a guarantee. There may be times where all investments and strategies are unfavorable and depreciate in value. Relative Strength is a measure of price momentum based on historical price activity. Relative Strength is not predictive and there is no assurance that forecasts based on relative strength can be relied upon
Average Level
22.35
| < - -100 | -100 - -80 | -80 - -60 | -60 - -40 | -40 - -20 | -20 - 0 | 0 - 20 | 20 - 40 | 40 - 60 | 60 - 80 | 80 - 100 | 100 - > |
|---|---|---|---|---|---|---|---|---|---|---|---|
|
Buy signalVOOV
|
|||||||||||
|
Buy signalEEM
|
|||||||||||
|
Buy signalshy
|
Buy signalicf
|
Buy signaliwm
|
|||||||||
|
Sell signalief
|
Buy signalefa
|
Buy signalrsp
|
Buy signalUSO
|
Buy signalSPY
|
Buy signalGCC
|
||||||
|
Sell signalagg
|
Sell signaldx/y
|
Buy signalfxe
|
Sell signaldia
|
Buy signalGSG
|
Buy signalVOOG
|
Buy signalONEQ
|
|||||
|
Sell signaltlt
|
Sell signalgld
|
Sell signallqd
|
Buy signalhyg
|
Buy signaldvy
|
Buy signalIJH
|
Buy signalijr
|
Buy signalXLG
|
Buy signalQQQ
|
|||
| < - -100 | -100 - -80 | -80 - -60 | -60 - -40 | -40 - -20 | -20 - 0 | 0 - 20 | 20 - 40 | 40 - 60 | 60 - 80 | 80 - 100 | 100 - > |
| AGG | iShares US Core Bond ETF |
| USO | United States Oil Fund |
| DIA | SPDR Dow Jones Industrial Average ETF |
| DVY | iShares Dow Jones Select Dividend Index ETF |
| DX/Y | NYCE U.S.Dollar Index Spot |
| EFA | iShares MSCI EAFE ETF |
| FXE | Invesco CurrencyShares Euro Trust |
| GLD | SPDR Gold Trust |
| GSG | iShares S&P GSCI Commodity-Indexed Trust |
| HYG | iShares iBoxx $ High Yield Corporate Bond ETF |
| ICF | iShares Cohen & Steers Realty ETF |
| IEF | iShares Barclays 7-10 Yr. Tres. Bond ETF |
| LQD | iShares iBoxx $ Investment Grade Corp. Bond ETF |
| IJH | iShares S&P 400 MidCap Index Fund |
| ONEQ | Fidelity Nasdaq Composite Index Track |
| QQQ | Invesco QQQ Trust |
| RSP | Invesco S&P 500 Equal Weight ETF |
| IWM | iShares Russell 2000 Index ETF |
| SHY | iShares Barclays 1-3 Year Tres. Bond ETF |
| IJR | iShares S&P 600 SmallCap Index Fund |
| SPY | SPDR S&P 500 Index ETF Trust |
| TLT | iShares Barclays 20+ Year Treasury Bond ETF |
| GCC | WisdomTree Continuous Commodity Index Fund |
| VOOG | Vanguard S&P 500 Growth ETF |
| VOOV | Vanguard S&P 500 Value ETF |
| EEM | iShares MSCI Emerging Markets ETF |
| XLG | Invesco S&P 500 Top 50 ETF |

FIVE Five Below Inc. R ($228.41) - Retailing - FIVE has been at least a 3 technical attribute stock for more than 12 months and maintained a 5 TA rating since June last year. The stock has maintained positive near- and long-term market and peer relative strength since June of last year and currently ranks within the top quintile of the Retailing sector matrix. On the default point and figure trend chart, FIVE has maintained a positive trend since April 2025, and trading during the latter part of this April brought about a return to a buy signal by completing a shakeout. After rallying to new highs at $248, FIVE finished off the final trading days of April by reversing down into Os toward the middle of the 10-week trading band. The stock is actionable here on a pullback or on a rally back towards highs in the upper $240s. We will utilize $190 as our initial stop as it would violate multiple levels of support. FIVE maintains a current reward to risk ratio north of 4 with a bullish price objective of $316, our current price target.
Long Ideas
Symbol
Company
Sector
Current Price
Action Price
Target
Stop
Notes
COST
Costco Wholesale Corporation
Retailing
$1012.79
944-1050s
1296
832
4 TA rating, top 33% of retail sector matrix, LT mkt RS buy, LT pos trend, consec buy signals, Earn. 5/28
DRI
Darden Restaurants, Inc.
Restaurants
$192.09
190s - low 200s
226
168
4 for 5'er, LT pos peer & mkt RS, pos trend flip, triple top, 3% yield
TJX
The TJX Companies, Inc.
Retailing
$154.64
150s - 160s
186
136
5 for 5'er. top third of RETA sector matrix, LR pos peer & mkt RS, triple top, Earn. 5/20
IBKR
Interactive Brokers Group, Inc.
Wall Street
$81.73
70s
100
73
5 for 5'er, top 20% of WALL sector matrix, LT pos peer & mkt RS, buy on pullback
BPOP
Popular, Inc.
Banks
$148.05
hi 130s - low 150s
200
120
5 for 5'er, 18 of 174 in favored BANK sector matrix, LT pos peer & mkt RS, triple top, good R-R, 2% yield
HAS
Hasbro, Inc.
Leisure
$93.96
lo-hi 90s
122
79
5 TA rating, top 33% of LEIS sector matrix, LT pos trend, pos wkly mom, Earn. 5/20
GRMN
Garmin Ltd.
Leisure
$238.60
mid 230s - mid 260s
364
196
5 TA rating, LT pos trend and mkt RS buy, top 33% of LEIS sector matrix, buy-on-pullback
SBUX
Starbucks Corporation
Restaurants
$104.97
hi 90s - mid 100s
1296
85
4 for 5'er, top 20% of REST sector matrix, mkt RS reversal to Xs, triple top, 2.35% yield
OSW
OneSpaWorld Holdings Ltd.
Leisure
$23.49
22 - 24
30.50
19
5 for 5'er, top half of LEIS sector matrix, LT pos peer & mkt RS, spread quintuple top
FIVE
Five Below Inc
Retailing
$231.03
hi 220s - hi 240s
316
190
5/5'er since 6/25; top quintile of Retail matrix; R-R Ratio > 4; Earnings 6/3.
Short Ideas
Symbol
Company
Sector
Current Price
Action Price
Target
Stop
Notes
CPRT
Copart Incorporated
Autos and Parts
$33.29
hi 30s
28
42
1 TA rating, bottom 50% of AUTO sector matrix, NT and mkt RS sell last month, consec sell signals,Earn. 5/21
DT
Dynatrace, Inc.
Software
$38.75
mid-30s
23
41
0 TA rating, bottom half of software sector matrix, LT neg trend, favorable reward-risk, Earn. 5/13
Removed Ideas
Symbol
Company
Sector
Current Price
Action Price
Target
Stop
Notes
SNA
Snap-on Incorporated
Machinery and Tools
$372.12
370s - 380s
444
320
SNA gave a sell signal and moved into a negative trend Tuesday. Okay to hold the 3 for 5'er here. Maintain $320 stop.
Follow-Up Comments
Comment
NDW Spotlight Stock
26
248.00
X
248.00
244.00
X
O
244.00
240.00
X
O
240.00
236.00
X
X
X
O
236.00
232.00
X
O
4
O
X
O
232.00
228.00
X
X
O
X
O
X
O
228.00
224.00
X
X
O
X
X
O
X
O
X
Mid
224.00
220.00
X
O
X
O
X
O
X
O
O
X
220.00
216.00
X
O
X
3
X
O
X
O
216.00
212.00
X
O
O
X
O
212.00
208.00
X
X
O
208.00
204.00
X
X
X
O
X
204.00
200.00
X
O
X
O
X
X
O
X
200.00
198.00
X
O
X
O
X
X
O
X
O
198.00
196.00
X
O
X
O
X
O
X
O
X
196.00
194.00
X
O
X
O
X
O
2
O
X
194.00
192.00
X
1
O
O
X
O
X
O
192.00
190.00
X
O
X
O
O
X
190.00
188.00
X
O
X
O
X
188.00
186.00
X
O
O
X
186.00
184.00
X
X
O
184.00
182.00
X
O
X
182.00
180.00
X
O
X
180.00
178.00
X
O
X
Bot
178.00
176.00
X
O
176.00
26
Create Watchlist
Create Watchlist
| AVGO Broadcom Ltd ($430.08) - Semiconductors - AVGO rose Tuesday to break a double top at $432, marking a second consecutive buy signal and a new all-time high. This 4 for 5'er moved to a positive trend in April and has been on an RS buy signal against the market since 2014. The weight of the technical evidence is favorable and improving, however, AVGO is now in an overbought position. Initial support can be seen at $396. Earnings are expected on 6/3. |
| CHD Church & Dwight Company ($94.13) - Household Goods - Shares of CHD broke a triple bottom at $91 to move back to a sell signal. The 4 for 5'er is in danger of moving into a negative trend, with its bullish support line close at $89. Those with positions should continue to hold but should watch for further deterioration, such as movement into a negative trend. |
| CRWD CrowdStrike Holdings, Inc. Class A ($478.23) - Software - CRWD rose Tuesday to complete a bullish catapult at $472 before rising to $480 intraday. This 4 for 5'er moved to a positive trend late in April and sits in the top quintile of the favored software sector RS matrix. The weight of the technical evidence is favorable and improving. Note that the stock is at resistance at $480. Initial support is seen at $440 with further support not seen until $376. |
| LRCX Lam Research Corporation ($275.47) - Semiconductors - LRCX rose Tuesday to break a triple top at $276, completing a shakeout pattern before rising to $280 intraday. This 4 for 5'er moved to a positive trend last May and has been on an RS buy signal against the market since 2023. The weight of the technical evidence is favorable and improving. Initial support can be seen at $244. |
| MRVL Marvell Technology Inc. ($169.50) - Semiconductors - MRVL advanced Tuesday to break a double top at $172, marking a fourth consecutive buy signal and new all-time high. This 4 for 5'er moved to a positive trend in March and sits in the top quartile of the favored semiconductors sector RS matrix. The technical picture is positive and improving, however, the stock is in a heavily overbought position. Initial support is seen at $148 with further support seen at $130. Note that earnings are expected on 5/27. |
| NTR Nutrien Ltd. ($77.67) - Chemicals - NTR returned to a buy signal and a positive trend Tuesday when it broke a double top at $77. The outlook for the stock remains negative, however, as even with the positive trend change NTR is an unfavorable 1 for 5'er. From here, the next level of resistance sits at $78. Meanwhile, support can be found at $70. |
| SHOP Shopify Inc ($106.79) - Retailing - SHOP reversed into Os and broke a double bottom at $118 to return to a sell signal as shares fell to $106. The move matches the 2026 chart low from February and violates the bullish support line on the trend chart, while the market RS chart will return to a column of Os, dropping the stock down to a 3 for 5'er. From here, a move below current chart levels below the $100 range would mark the stock's lowest level in roughly 12 months. |
| SPOT Spotify Technology S.A. ($416.37) - Media - After putting together all the markings of a failed breakout on its default chart, SPOT has journeyed back within one box of its 2026 lows at $408. The 1/5'er should continue to be avoided for now until further technical improvement is seen. Trim on bounces back towards resistance at $448. |

| Name | Option Symbol | Action | Stop Loss |
|---|---|---|---|
| ONEOK, Inc. - $90.63 | O: 26I90.00D18 | Buy the September 90.00 calls at 6.60 | 81.00 |
| Name | Option | Action |
|---|---|---|
| DuPont de Nemours Inc. ( DD) | Jul. 45.00 Calls | Initiate an option stop loss of 3.10 (CP: 5.10) |
| UBS AG (Switzerland) ADR ( UBS) | Aug. 40.00 Calls | Initiate an option stop loss of 3.70 (CP: 5.70) |
| Shopify Inc ( SHOP) | Jul. 125.00 Calls | Stopped at 13.55 (CP: 5.05) |
| Fortinet Inc. ( FTNT) | Jul. 85.00 Calls | Raise the option stop loss to 8.50 (CP: 10.05) |
| Name | Option Symbol | Action | Stop Loss |
|---|---|---|---|
| Molson Coors Company - $42.43 | O: 26S42.50D17 | Buy the July 42.50 puts at 2.65 | 46.00 |
| Name | Option | Action |
|---|---|---|
| Abbott Laboratories ( ABT) | Aug. 115.00 Puts | Raise the option stop loss to 24.60 (CP: 26.60) |
| Cognizant Technology Solutions ( CTSH) | Sep. 62.50 Puts | Raise the option stop loss to 8.90 (CP: 10.90) |
| Name | Option Sym. | Call to Sell | Call Price | Investment for 500 Shares | Annual Called Rtn. | Annual Static Rtn. | Downside Protection |
|---|---|---|---|---|---|---|---|
| Citigroup, Inc. $ 125.63 | O: 26G130.00D17 | Jul. 130.00 | 6.80 | $ 61,289.15 | 25.05% | 22.24% | 4.26% |
| Name | Action |
|---|---|
| Palantir Technologies Inc. Class A ( PLTR) - 146.03 | Sell the July 150.00 Calls. |
| V.F. Corporation ( VFC) - 18.39 | Sell the August 22.00 Calls. |
| Delta Air Lines Inc. ( DAL) - 68.50 | Sell the July 72.50 Calls. |
| Starbucks Corporation ( SBUX) - 104.97 | Sell the September 110.00 Calls. |
| General Motors ( GM) - 75.70 | Sell the September 77.50 Calls. |
| Invesco PLC ( IVZ) - 26.04 | Sell the July 27.00 Calls. |
| Name | Covered Write |
|---|---|
| Synchrony Financial ( SYF - 74.24 ) | September 80.00 covered write. |
Daily Equity & Market Analysis
LISTEN TO PODCAST
Apr 30, 2026
Loading, Please Wait...
