
Today we continue our three part series breaking down three common arguments against trend following. Today's topic- the idea that momentum "chases winners", inefficiently buying high and selling low.
Note- this is the second edition of a larger study detailing how you can answer several frequently asked questions your clients might have when considering the broader momentum factor. Click here to read part 1, addressing the idea that momentum investing is “streaky” in comparison to other factors. Next Wednesday, we will address the final FAQ, the idea that momentum is tax inefficient. We will also include all three pieces together to make it easy to reference going forwards. With any questions/concerns, email miles.clark@nasdaq.com
Like any investment process, trend following is not without its share of ups and downs. Over time, buying winners and cutting losers can foster a strong point‑to‑point return stream, but the inter‑period experience of momentum investing can be difficult to stomach as natural rotation occurs and trends change. Time and time again, shifts in leadership create uncomfortable situations that often run counter to our natural “gut” instincts, causing even the most loyal trend follower to consider deviating from the rules. These untimely breakdowns in systematic rule‑following allow emotion to creep in at precisely the wrong moment, potentially erasing years’ worth of discipline- either psychologically, monetarily, or quite often, both.
With that in mind, we have taken the opportunity to break down several of the major roadblocks and common arguments that inevitably arise for trend followers. Our hope is that by better understanding the typical pitfalls of momentum investing, we can more appropriately contextualize returns over time.
Major arguments commonly raised against the momentum factor typically include:
- Trend following is “streaky” and, as a result, does not belong in the average portfolio.
- Trend following often “chases winners” inefficiently, leading to frequent whipsaws.
- Frequent rotation driven by changing market leadership creates material tax inefficiencies.
Buying High, Selling Higher?
Momentum typically doesn’t adhere to the classic adage, “buy low, sell high”. Instead, the factor targets securities that have already established strong relative strength, essentially aiming to “buy high, sell higher” based on attractive performance metrics. This methodology sits at odds with other widely followed factors- a stock can reasonably become “too expensive” for a value investor or produce an “insufficient growth trajectory” for a growth investor. Since a stock can almost never “outprice” itself to the upside for a momentum strategy, a common critique is the factor’s perceived tendency to chase names that have already exhausted their upside, otherwise “buying high and selling low”.
To evaluate how significant this concern may be, we examined the trade distribution of the NDW Large Cap Core model, which seeks to hold high relative strength securities within the top 500 stocks by market cap over time. Since the start of 1992, the model has continuously rotated to RS winners, trading (if needed) on a monthly basis. Before proceeding, it is worth noting an important statistical caveat: equity returns are inherently non‑normal. Upside returns are theoretically unbounded, while downside outcomes are limited to a maximum loss of 100%. Despite this asymmetry, a trade distribution remains useful for visualizing how frequently the model captures extreme positive outcomes.
Across the full dataset, eight trades produced returns in excess of 400% before exiting the model- effectively placing them more than three standard deviations above the average trade outcome. As of August 2025, these eight observations represent 0.73% of the 1,090 total trades executed since 1992. Under a normally distributed framework, only 0.135% of observations would be expected to fall beyond three standard deviations above the mean. Put differently, the model captures extreme right-tail outcomes at a substantially higher rate than what would be considered statistically “normal.”
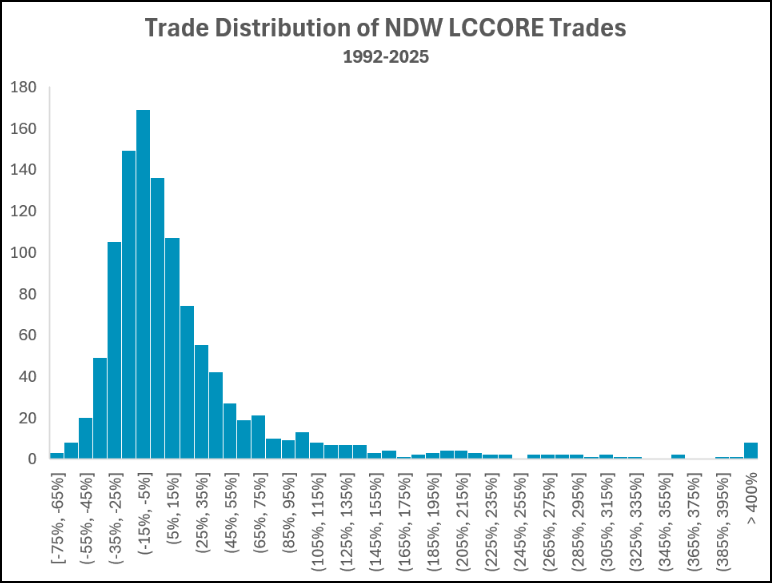
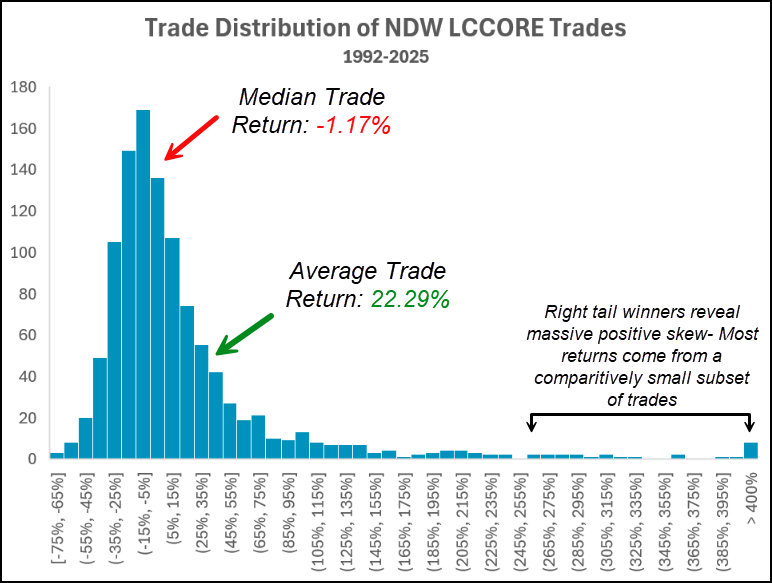
While the histogram illustrates the frequency of these outcomes, it fails to depict their importance to a model’s return stream over time. The single largest observed trade generated a return just shy of 2,775%, a magnitude that is difficult to contextualize using a standard distribution alone. Across all trades, the average return is 22.29%. Removing only the eight aforementioned right‑tail winners reduces that average nearly in half, to 14.57%. While still attractive, this sharp decline indicates that a small number of exceptional winners account for a disproportionate share of total returns.
This dynamic becomes even clearer when examining median outcomes. Unlike the mean, the median dampens the influence of extreme outliers. On this basis, the median trade return falls to –1.17%, implying that more than half of all trades are actually modest losers. This suggests that the model’s return profile is positively skewed: a handful of very large winners are the featured drivers of long-term returns, while the majority of trades reflect routine turnover as the model systematically removes positions that fail to demonstrate sustained leadership.
All this to say, this evidence suggests that constant rotation of “buying high” is not necessarily a liability for momentum strategies, but rather the defining feature that drives long‑term results. To realize a return on the order of ~2,800%, a security would almost certainly have violated the selection criteria of even the most flexible value or growth frameworks along the way. While trend following may involve periods of whipsaw as it searches for these comparatively exceptional winners, its systematic ability to remain invested in “golden ticket” securities longer than other approaches is ultimately the hallmark of the factor over time.
