Most Requested Symbols

The ICE U.S Dollar Spot Index (DX/Y) returns for a buy signal for the time since January 2025.
A common question we get from clients is if momentum has been doing well, then should I look to rotate out of the factor?
Weekly Rundown Video – Mar 12, 2026
Weekly rundown with NDW analyst team covering all major asset classes.
Weekly rundown with NDW analyst team covering all major asset classes.
While Monday’s (3/16) action saw the U.S. Dollar pullback ahead of a number of central banks global meeting this week, it follows Friday’s (3/13) rally to the Dollar’s highest level since May 2025. The move above $100.50 for the ICE U.S. Dollar Spot Index (DX/Y) brought the chart back to a buy signal for the first time since January 2025 with a triple top buy. The recent rally, driven in the near-term by geopolitical tensions in the middle east that began in February, comes after the dollar had fallen to $96 in January, the currency’s lowest level since early 2022.
The default 0.50 point per box chart returning to a buy signal is a silver lining in what has generally been a bleak picture for the greenback for the prior 12+ months, but the index still maintains a long-term negative trend, trading below the bearish resistance line. Both the default chart and long-term 1 point per box chart highlight the $100 level being an inflection point, having been resistance since July last year and support prior to that from July 2023.
Weekly momentum has been positive for three weeks now, suggesting the potential for higher prices to continue for at least 3 to 5 more weeks on average. Moving forward, investors will watch to see if the Dollar can build on its recent rally to return the long-term 1 point per box chart a buy signal, which would occur with a move above $101. For both the default 0.50 point per box chart and long-term 1 point per box chart, a move to range would change the long the mid-$100 range for the bearish resistance line to be penetrated and the long-term trend to return back to positive.

While investors will watch for further developments on the trend front, it is worth noting the near-term developments for greenback-related funds on the relative front. The peer relative strength chart comparing the Invesco DB U.S. Dollar Index Bullish Fund (UUP) versus the NDW Foreign Currency Index (DWAFXI) on a 2% scale reversed back into Xs following Thursday’s (3/12) action after having been in a column of Os since December 2025. The long-term relative strength still favors the foreign currency index, highlighting the need for further long-term technical developments for the U.S. Dollar to overtake foreign currencies. Apart from the near-term rise relative to its peers, UUP continues to be weak on a near and long-term basis versus other risk-on asset classes. Though still weak from a relative standpoint for the time being, further improvement could lead to further potential gains in relative strength.


A common question we get from clients is if momentum has been doing well, then should I look to rotate out of the factor? To try to answer that question, we first need to find a measure for the current state of momentum. One measure would be the RS Spread Index (RSSPREAD) which looks at the difference in performance between a basket of high-momentum names versus a basket of low-momentum names. If the RS Spread Index is moving higher, then the high-momentum names are performing better than the low-momentum names and vice versa. Using the RSSPREAD, we looked at the rolling 3-month performance of the index with reading above 15% being considered “hot” momentum markets. While there have been periods that have well exceeded 15% (tech bubble era, GFC, and covid), it is an acceptable line of demarcation in “normal” market environments.
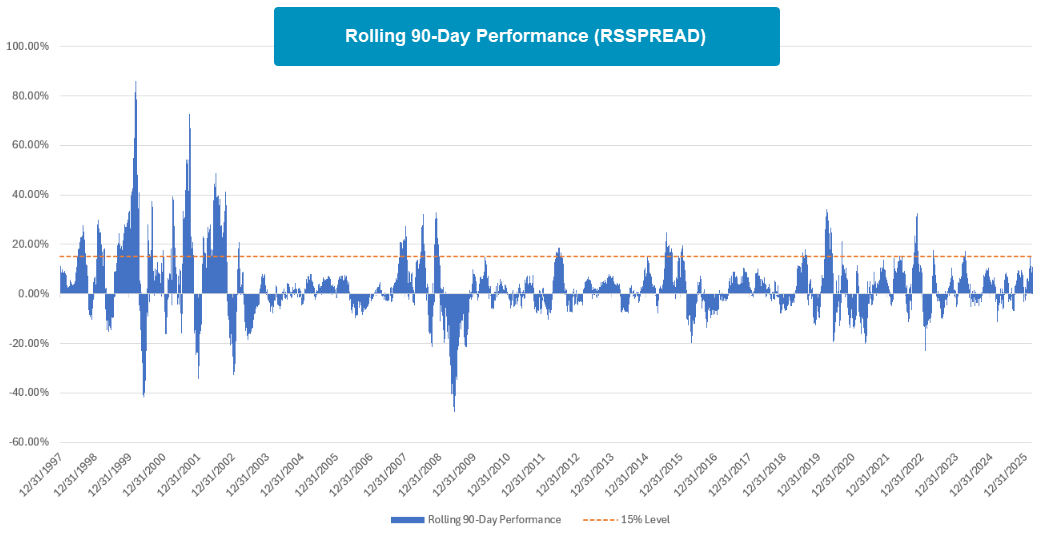
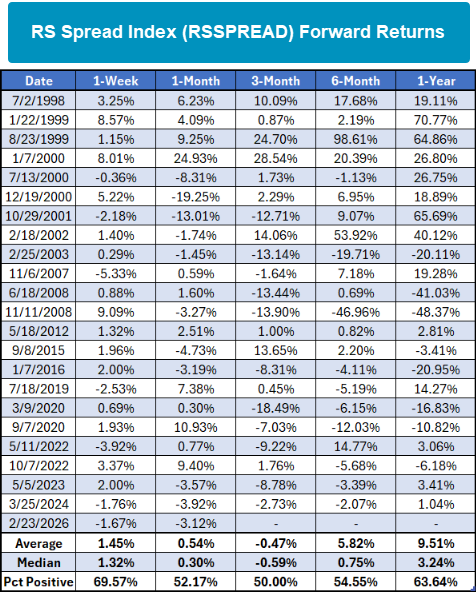
Now that we have a measure for “hot” momentum markets, let’s look at how momentum strategies fair moving forward. As a first look, the performance of RSSPREAD following a 15% gain over the last three months should give a decent indication of how momentum strategies fair moving forward. The table below breaks down the results. We’ve removed clusters within three months to look at first occurrences only. RSSPREAD tends to continue to push higher on short-term and long-term time frames, however, the three-month period was rough spot compared to the other time periods observed. Even though the average and median numbers were slightly negative over the three-month period, it was not material enough to say that it’s worth rotating out of momentum strategies. This is especially the case when looking at the one-year numbers.
While RSSPREAD may give us the indication that momentum strategies can continue to do well following a strong momentum backdrop, it is not a directly investible asset. To remedy this, we’ve looked at the performance spread between the Invesco Nasdaq Dorsey Wright Momentum ETF (PDP) and the S&P 500 Equal Weight Index (SPXEWI). On average, PDP outperformed SPXEWI over each time frame observed but this outperformance becomes more muted when looking at the median. The percent positive metric is typically sticky around 50%, so it’s a coin flip whether PDP outperforms SPXEWI over the observed time frames. At worst, there appears to be no clear indication that momentum strategies will suffer after a strong run. To get back to the original question, if momentum has been doing well, then should I look to rotate out of the factor? There’s not much evidence supporting rotating out of momentum following a good performance window in the long run.

Average Level
-18.32
| < - -100 | -100 - -80 | -80 - -60 | -60 - -40 | -40 - -20 | -20 - 0 | 0 - 20 | 20 - 40 | 40 - 60 | 60 - 80 | 80 - 100 | 100 - > |
|---|---|---|---|---|---|---|---|---|---|---|---|
|
Buy signalshy
|
|||||||||||
|
Buy signalefa
|
|||||||||||
|
Buy signaliwm
|
|||||||||||
|
Sell signalagg
|
Buy signalrsp
|
||||||||||
|
Buy signalijr
|
Sell signalONEQ
|
||||||||||
|
Buy signalSPY
|
Sell signalVOOG
|
||||||||||
|
Sell signallqd
|
Buy signalVOOV
|
Sell signaltlt
|
|||||||||
|
Buy signalfxe
|
Buy signalIJH
|
Buy signalQQQ
|
Buy signalEEM
|
Buy signaldx/y
|
Buy signalGSG
|
||||||
|
Buy signalhyg
|
Buy signaldia
|
Sell signalXLG
|
Buy signalief
|
Buy signaldvy
|
Buy signalGLD
|
Buy signalicf
|
Buy signalGCC
|
Buy signalUSO
|
|||
| < - -100 | -100 - -80 | -80 - -60 | -60 - -40 | -40 - -20 | -20 - 0 | 0 - 20 | 20 - 40 | 40 - 60 | 60 - 80 | 80 - 100 | 100 - > |
| AGG | iShares US Core Bond ETF |
| USO | United States Oil Fund |
| DIA | SPDR Dow Jones Industrial Average ETF |
| DVY | iShares Dow Jones Select Dividend Index ETF |
| DX/Y | NYCE U.S.Dollar Index Spot |
| EFA | iShares MSCI EAFE ETF |
| FXE | Invesco CurrencyShares Euro Trust |
| GLD | SPDR Gold Trust |
| GSG | iShares S&P GSCI Commodity-Indexed Trust |
| HYG | iShares iBoxx $ High Yield Corporate Bond ETF |
| ICF | iShares Cohen & Steers Realty ETF |
| IEF | iShares Barclays 7-10 Yr. Tres. Bond ETF |
| LQD | iShares iBoxx $ Investment Grade Corp. Bond ETF |
| IJH | iShares S&P 400 MidCap Index Fund |
| ONEQ | Fidelity Nasdaq Composite Index Track |
| QQQ | Invesco QQQ Trust |
| RSP | Invesco S&P 500 Equal Weight ETF |
| IWM | iShares Russell 2000 Index ETF |
| SHY | iShares Barclays 1-3 Year Tres. Bond ETF |
| IJR | iShares S&P 600 SmallCap Index Fund |
| SPY | SPDR S&P 500 Index ETF Trust |
| TLT | iShares Barclays 20+ Year Treasury Bond ETF |
| GCC | WisdomTree Continuous Commodity Index Fund |
| VOOG | Vanguard S&P 500 Growth ETF |
| VOOV | Vanguard S&P 500 Value ETF |
| EEM | iShares MSCI Emerging Markets ETF |
| XLG | Invesco S&P 500 Top 50 ETF |

| Symbol | Company | Sector | Current Price | Action Price | Target | Stop | Notes |
|---|---|---|---|---|---|---|---|
| ABBV | AbbVie Inc. | Drugs | $221.45 | 210s - low 230s | 284 | 188 | 5 for 5'er, favored DRUG sector, LT pos peer & mkt RS, breakout from consec sell signals, 2.9% yield |
| AB | AllianceBernstein Holding LP | Wall Street | $38.06 | low 40s | 64 | 32 | 3 TA rating, LT mkt RS buy, LT pos trend, top 50% of WALL sector matrix, consec buy signals, buy-on-pullback, yield > 8% |
| ZWS | Zurn Elkay Water Solutions Corp. | Machinery and Tools | $45.19 | hi 40s - lo 50s | 95 | 42 | 5 TA rating, LT pos trend, LT mkt RS buy, consec buy signals, buy-on-pullback |
| CACI | CACI International Inc. | Computers | $605.35 | 570s - 600s | 672 | 528 | 5 for 5'er, top 25% of COMP sector matrix, LT pos mkt RS, triple top breakout |
| WBS | Webster Financial Corporation | Banks | $67.98 | hi 60s - low 70s | 91 | 58 | 4 for 5'er, top 25% of BANK sector matrix, one box from peer RS buy, buy on pullback, 2.2% yield |
| MCK | McKesson Corporation | Drugs | $943.25 | 396-hi 470s | 1304 | 752 | 5 TA rating, top 33% of DRUG sector matrix, LT RS buy, consec buy signals, buy-on-pullback |
| CGON | CG Oncology, Inc. | Biomedics/Genetics | $65.90 | hi 50s - low 60s | 80 | 50 | 5 for 5'er, 18 of 162 in BIOM sector matrix, bullish catapult, good R-R, Earn. 3/26 |
| AZN | Astrazeneca Group PLC Ads (United Kingdom) ADR | Drugs | $192.01 | mid 180s - upper 190s | 236 | 160 | 4 for 5'er, top 25% of DRUG sector matrix, LT pos peer RS, one box from mkt RS buy, bullish triangle |
| RTX | RTX Corp. | Aerospace Airline | $206.06 | upper 190s to mid 210s | 254 | 166 | 4/5'er; top third of Aero matrix; Peer RS within 1 box of RS buy; ATHs on 3/2. |
| COCO | Vita Coco Company, Inc. | Food Beverages/Soap | $60.60 | mid-to-hi 50s | 72 | 48 | 5 for 5'er, top half of FOOD sector matrix, LT pos peer & mkt RS, pos trend flip |
| DGII | Digi International Inc | Telephone | $50.40 | upper 40s to lower 50s | 61 | 40 | 5 for 5'er; top quartile of Telephone matrix; buy signal since May '25, pos. trend since June '25. |
| ASND | Ascendis Pharma A/S | Biomedics/Genetics | $231.03 | 220s - low 230s | 282 | 188 | 4 for 5'er, top third of BIOM sector matrix, LT pos peer & mkt RS, bullish triangle, buy on pullback |
| BRX | Brixmor Property Group Inc | Real Estate | $29.97 | hi 20s - lo 30s | 38 | 24 | 4 for 5'er, top third of REAL sector matrix, LT pos peer & mkt RS, LT pos trend, bullish triangle, 4% yield |
| CNX | CNX Resources Corp | Oil | $41.96 | hi 30s - mid 40s | 71 | 33 | 5 TA rating, top 50% of OIL sector matrix, LT RS buy and pos trend, consec buy signals |
| Symbol | Company | Sector | Current Price | Action Price | Target | Stop | Notes |
|---|---|---|---|---|---|---|---|
| CPRT | Copart Incorporated | Autos and Parts | $33.88 | hi 30s | 28 | 42 | 1 TA rating, bottom 50% of AUTO sector matrix, NT and mkt RS sell last month, consec sell signals |
| Comment | |||||||
|---|---|---|---|---|---|---|---|
|
|
|||||||
CNX CNX Resources Corp ($41.91) R - Oil - CNX has a 5 for 5 TA rating and sits in the top half of the favored oil sector RS matrix. The stock has been in a positive trend and on an RS buy signal since 2023, confirming long-term relative strength. The recent chart action saw CNX break out to a new multi-year high earlier this month before retracting back to the current chart position near $40. The weight of the technical evidence is robust and improving. Exposure can be considered in the high $30s to mid-$40s. Our initial stop will be positioned at $33, which would violate multiple support levels from the current position. The bullish price objective of $71 will serve as our price target, offering a reward-to-risk north of 3-to-1.
| 24 | 25 | 26 | |||||||||||||||||||||||||||
| 43.00 | X | 43.00 | |||||||||||||||||||||||||||
| 42.00 | X | 3 | O | 42.00 | |||||||||||||||||||||||||
| 41.00 | X | X | O | X | X | O | 41.00 | ||||||||||||||||||||||
| 40.00 | X | O | C | O | X | O | X | O | 40.00 | ||||||||||||||||||||
| 39.00 | X | O | X | O | 2 | O | X | 39.00 | |||||||||||||||||||||
| 38.00 | X | C | X | O | X | O | Mid | 38.00 | |||||||||||||||||||||
| 37.00 | X | X | O | X | O | X | 37.00 | ||||||||||||||||||||||
| 36.00 | X | O | X | O | X | 1 | X | 36.00 | |||||||||||||||||||||
| 35.00 | X | O | X | O | X | X | B | O | X | 35.00 | |||||||||||||||||||
| 34.00 | X | B | 1 | 6 | O | X | O | X | O | 34.00 | |||||||||||||||||||
| 33.00 | A | O | X | O | X | O | A | 33.00 | |||||||||||||||||||||
| 32.00 | X | O | 3 | 5 | 7 | O | X | 32.00 | |||||||||||||||||||||
| 31.00 | X | O | X | O | X | O | 9 | Bot | 31.00 | ||||||||||||||||||||
| 30.00 | X | O | 2 | O | X | O | X | 30.00 | |||||||||||||||||||||
| 29.00 | 9 | O | X | 4 | X | 8 | X | 29.00 | |||||||||||||||||||||
| 28.00 | X | O | X | O | O | • | 28.00 | ||||||||||||||||||||||
| 27.00 | 7 | X | O | • | 27.00 | ||||||||||||||||||||||||
| 26.00 | X | O | X | • | 26.00 | ||||||||||||||||||||||||
| 25.00 | 5 | O | X | • | 25.00 | ||||||||||||||||||||||||
| 24.00 | X | 8 | • | 24.00 | |||||||||||||||||||||||||
| 23.00 | 9 | X | • | 23.00 | |||||||||||||||||||||||||
| 22.00 | X | O | 3 | • | 22.00 | ||||||||||||||||||||||||
| 21.00 | 8 | O | X | • | 21.00 | ||||||||||||||||||||||||
| 20.00 | X | C | X | • | 20.00 | ||||||||||||||||||||||||
| 19.50 | X | O | • | 19.50 | |||||||||||||||||||||||||
| 19.00 | X | • | 19.00 | ||||||||||||||||||||||||||
| 18.50 | 7 | • | 18.50 | ||||||||||||||||||||||||||
| 18.00 | X | • | 18.00 | ||||||||||||||||||||||||||
| 17.50 | X | • | 17.50 | ||||||||||||||||||||||||||
| 17.00 | • | • | X | • | 17.00 | ||||||||||||||||||||||||
| 16.50 | 3 | • | 4 | • | • | 6 | • | 16.50 | |||||||||||||||||||||
| 16.00 | X | O | X | O | X | • | X | • | 16.00 | ||||||||||||||||||||
| 15.50 | X | O | X | O | X | O | X | • | 15.50 | ||||||||||||||||||||
| 15.00 | O | X | O | X | O | X | • | 15.00 | |||||||||||||||||||||
| 14.50 | O | O | 5 | • | 14.50 | ||||||||||||||||||||||||
| 24 | 25 | 26 |
| CC The Chemours Company ($19.09) - Chemicals - CC returned to a buy signal Tuesday when it broke a double top at $18.50. Thursday's move adds to an already positive technical outlook as CC is a 4 for 5'er that ranks in the top quintile of the chemicals sector matrix. From here, overhead resistance sits at $21, while support can be found at $15.50. |
| EBAY eBay Inc. ($94.30) - Retailing - EBAY broke a double top at $95 for a third buy signal since late February. The stock has improved to a 4 for 5'er with the recent trend flip to positive and peer RS chart reversing back into a column of Xs. Okay to consider here on the breakout. Note resistance at $97 and $100, the stock's all-time chart high. Initial support lies at $90, while additional can be found in the mid-$80s. |
| LRCX Lam Research Corporation ($224.79) - Semiconductors - LRCX pushed higher Tuesday to break a double top at $224. This 5 for 5'er moved to a positive trend in May and sits in the top third of the favored semiconductors sector RS matrix. The stock has also been on an RS buy signal against the market and its peers since 2023. The weight of the long-term technical evidence is favorable and the stock is showing near-term improvement again. Initial support can be seen at $208 with further support at $196. |
| SRE Sempra Energy ($96.17) - Gas Utilities - SRE broke a double top at $97 to return to a buy signal and match the stock's all-time chart high. The stock has been a 3 for 5'er since October last year and maintains a yield north of 2%. Okay to consider here on the breakout. Initial support lies at $91, while the bullish support line sits at $86. |
| XOM Exxon Mobil Corporation ($158.81) - Oil - XOM gave a fourth consecutive buy signal and reached a new all-time high Tuesday when it broke a double top at $160. Tuesday's move adds to a positive overall picture as XOM is a 4 for 5'er and ranks in the top quintile of the oil sector matrix. However, Tuesday's move has pushed the stock into heavily extended territory. From here, the first level of support sits at $148. |

| Name | Option Symbol | Action | Stop Loss |
|---|---|---|---|
| Target Corporation - $116.81 | O: 26E115.00D15 | Buy the May 115.00 calls at 7.60 | 110.00 |
| Name | Option | Action |
|---|---|---|
|
|
||
| Name | Option Symbol | Action | Stop Loss |
|---|---|---|---|
| Dutch Bros Inc. Class A - $51.56 | O: 26S52.50D17 | Buy the July 52.50 puts at 7.30 | 56.00 |
| Name | Option | Action |
|---|---|---|
| General Mills, Inc. ( GIS) | Jun. 47.50 Puts | Raise the option stop loss to 7.30 (CP: 9.30) |
| Delta Air Lines Inc. ( DAL) | May. 65.00 Puts | Stopped at 6.80 (CP: 5.15) |
| PepsiCo, Inc. ( PEP) | Jul. 160.00 Puts | Raise the option stop loss to 8.30 (CP: 10.30) |
| Zoetis Inc. ( ZTS) | Jul. 120.00 Puts | Stopped at 8.60 (CP: 7.00) |
| Name | Option Sym. | Call to Sell | Call Price | Investment for 500 Shares | Annual Called Rtn. | Annual Static Rtn. | Downside Protection |
|---|---|---|---|---|---|---|---|
| Starbucks Corporation $ 97.82 | O: 26G100.00D17 | Jul. 100.00 | 6.00 | $ 46,383.65 | 20.17% | 16.01% | 5.08% |
| Name | Action |
|---|---|
| Intel Corporation ( INTC) - 45.76 | Sell the May 49.00 Calls. |
| Freeport-McMoRan Inc. ( FCX) - 57.93 | Sell the June 65.00 Calls. |
| Micron Technology, Inc. ( MU) - 441.80 | Sell the June 420.00 Calls. |
| Moderna, Inc. ( MRNA) - 53.31 | Sell the April 55.00 Calls. |
| Fortinet Inc. ( FTNT) - 84.49 | Sell the May 85.00 Calls. |
| Devon Energy Corporation ( DVN) - 46.65 | Sell the June 47.50 Calls. |
| Name | Covered Write |
|---|---|
| Iron Mountain Inc. ( IRM - 107.52 ) | July 110.00 covered write. |
Daily Equity & Market Analysis
LISTEN TO PODCAST
Mar 12, 2026
Loading, Please Wait...
