Most Requested Symbols

Your clients are probably interested in picking up energy exposure....but the space is a bit overbought. Today we talk about relative improvements and a handful of stock ideas.
The recent stagnation in growth stocks stands in sharp contrast to the market leadership they displayed over the past several years. With recent movement, is it time to dump value stocks or should investors be patient for a rebound?
Weekly Rundown Video – Mar 12, 2026
Weekly rundown with NDW analyst team covering all major asset classes.
Weekly rundown with NDW analyst team covering all major asset classes.
It isn’t always easy to convince yourself to buy something that's up 30% already this year…. But in theory us trend followers certainly could. Having a proper system in place to properly navigate purchase of overbought assets is paramount, as is establishing a checks and balances system to ensure you aren’t in the business of getting whipsawed around when putting new money to work. Lots of research has discussed the uptick for energy focused names, and as the space has backed off of recent highs, we will highlight a large relative strength change worth watching as we close Q1.
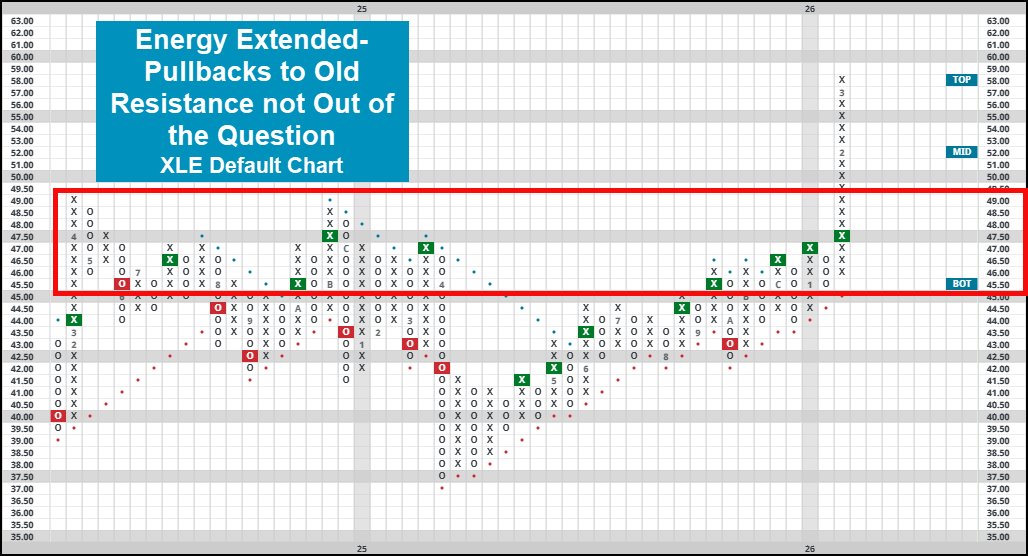
Before doing so, we will offer a brief technical comment for XLE, which has been lifted higher by the storm forwards for crude as unrest in the Middle East surges onwards. Sitting in a string of 17 X’s on its default chart, the overall technical picture for the broad energy fund is certainly extended. Using a more sensitive $.25 scale to help identify more localized levels of support and resistance, pullbacks to the mid-$50’s are certainly not out of the question. On more sustained downside action, a trip back down to a range of old resistance in the mid/upper $40’s would be realistic. It goes without saying that price action in the energy space is currently driven by headlines stemming from the Middle East, but keeping these technical levels in mind can help contextualize movement as it occurs.
As you might expect, the swift upside action for XLE has also led to notable relative improvement against other areas of the market. Specifically, XLE returned to a relative strength (RS) buy signal against the S&P 500 on 3/12. While there have been a fair share of headfakes in the dataset, an investor following an RS Switching strategy (owning whichever asset was on a buy signal) is a historically profitable strategy over a buy and hold of either asset individually. The last instance of this chart moving back to a buy signal was in January of 2022… a year we now know to be historically poor for domestic equites in general. While there is still plenty of time left in 2026, it will be important to watch this chart for further relative action to see if areas outside of the core will continue to lead.

To close today’s piece, we will look underneath the hood of XLE to find four and five attribute stocks that aren’t overbought, of which there are five names (BKR, DVN, EQT, WMB, & XOM). Of this list, the best-looking name is either EQT or XOM. Both of these are high attribute names that maintain their respective buy signals on their default chart. EQT (pictured below) has moved nicely along its bullish support line, sitting at all-time chart highs. Reversals lower could see the 4/5’er head back to the middle of the trading band at $58 and could be a possible entry point for those of you looking to be a bit more defensive with putting new money to work. XOM has backed off of recent highs, establishing support just above the middle of the trading band. Similar reversals to the $146-$148 mark could offer an opportunity to add to existing positions. Remember, the energy space is no stranger to large swings one way or the other, especially when there is unrest on the global stage. Keep this in mind when looking for new names and finding relevant support and resistance points.


Some market relationships are worth monitoring regardless of the broader environment, and few are more important than the dynamic between value and growth. Earlier this year, we noted early signs that momentum was shifting toward value‑oriented areas, and since then the trend has continued to strengthen. With recent movement, is it time to dump value stocks or should investors be patient for a rebound?
The recent stagnation in growth stocks stands in sharp contrast to the market leadership they displayed over the past several years. The Vanguard Growth ETF (VUG) is approaching correction territory, trading roughly 10% below its October highs. The fund is now on a streak of four consecutive sell signals, with it now sitting just above its bullish support line at $445. Movement lower would bring it to a negative trend for the first time since last year’s tariff tantrum. This decline has also weakened its relative strength, with VUG’s fund score falling nearly two points to 3.81. Value stocks, by contrast, have been trending decisively higher. Looking at the Vanguard Value ETF (VTV), it has been trading in the same column of Xs dating back to April of last year. As a result of its upside this year, its fund of 4.11 finally surpassed VUG, marking another noticeable shift in leadership from the last several years.

Evaluating growth stocks and value stocks individually can give insight into which group is in favor, but we can gain further context by looking at the relationship between the two. Specifically, the relative strength chart between VUG and VTV is among the most important indicators of market leadership. Historically, following whichever fund holds an RS buy signal has outperformed owning either fund individually, underscoring the importance of the relationship. Growth has displayed long-term strength over value on the chart since 2023, but action at the start of the year saw VTV regain near-term strength. Since that reversal, the market has moved even more in favor of value, leaving VTV just two boxes away from overtaking VUG's long-term strength for just the third time in the chart’s history.

Additionally, it hasn’t just been the largest names driving the discrepancy between growth and value. Broad participation across domestic equities remains at acceptable levels, but value stocks are contributing to the upside at a meaningfully higher rate than growth stocks. Specifically, the percentage of large cap growth stocks trading in a positive trend (^PTLCG) sits at a respectable 56%, but tis hovering around its lowest levels since May. However, the positive percentage for large cap value stocks (^PTLCV) is in a different stratosphere, with 78% of the group trading in a positive trend, underscoring the abnormally strong participation from value stocks. While the rebound in value stocks has been impressive, participation readings for the group are also in abnormally elevated territory. For reference, the last time ^PTLCV matched our current levels was almost two decades ago. A reversal in ^PTLCV from here would suggest value may be due for a near‑term cooling period, as the market has historically been unable to sustain such elevated readings for long.

While anecdotal, recent action resembles the pattern seen in growth stocks at the beginning of last year, when VUG also recorded four consecutive sell signals. In hindsight, we know that growth eventually rebounded as the Tariff Tantrum unwound, but where the cards will fall this time still has yet to be seen. While growth holds the lead in long-term strength, the market has certainly seen initial signs of change, with value holding a better near-term outlook, making the relationship one to keep an eye on in the coming months.
Average Level
-28.97
| < - -100 | -100 - -80 | -80 - -60 | -60 - -40 | -40 - -20 | -20 - 0 | 0 - 20 | 20 - 40 | 40 - 60 | 60 - 80 | 80 - 100 | 100 - > |
|---|---|---|---|---|---|---|---|---|---|---|---|
|
Buy signalSPY
|
|||||||||||
|
Buy signalVOOV
|
|||||||||||
|
Sell signalXLG
|
|||||||||||
|
Buy signaliwm
|
|||||||||||
|
Buy signalijr
|
|||||||||||
|
Sell signalONEQ
|
|||||||||||
|
Buy signalIJH
|
|||||||||||
|
Buy signalrsp
|
|||||||||||
|
Buy signaldia
|
Sell signalVOOG
|
||||||||||
|
Buy signalefa
|
Buy signalEEM
|
||||||||||
|
Buy signalhyg
|
Buy signalshy
|
Buy signalief
|
Buy signalGSG
|
||||||||
|
Buy signalfxe
|
Sell signallqd
|
Sell signalagg
|
Sell signaltlt
|
Buy signalQQQ
|
Buy signaldvy
|
Buy signalGLD
|
Buy signalicf
|
Buy signalGCC
|
Buy signaldx/y
|
Buy signalUSO
|
|
| < - -100 | -100 - -80 | -80 - -60 | -60 - -40 | -40 - -20 | -20 - 0 | 0 - 20 | 20 - 40 | 40 - 60 | 60 - 80 | 80 - 100 | 100 - > |
| AGG | iShares US Core Bond ETF |
| USO | United States Oil Fund |
| DIA | SPDR Dow Jones Industrial Average ETF |
| DVY | iShares Dow Jones Select Dividend Index ETF |
| DX/Y | NYCE U.S.Dollar Index Spot |
| EFA | iShares MSCI EAFE ETF |
| FXE | Invesco CurrencyShares Euro Trust |
| GLD | SPDR Gold Trust |
| GSG | iShares S&P GSCI Commodity-Indexed Trust |
| HYG | iShares iBoxx $ High Yield Corporate Bond ETF |
| ICF | iShares Cohen & Steers Realty ETF |
| IEF | iShares Barclays 7-10 Yr. Tres. Bond ETF |
| LQD | iShares iBoxx $ Investment Grade Corp. Bond ETF |
| IJH | iShares S&P 400 MidCap Index Fund |
| ONEQ | Fidelity Nasdaq Composite Index Track |
| QQQ | Invesco QQQ Trust |
| RSP | Invesco S&P 500 Equal Weight ETF |
| IWM | iShares Russell 2000 Index ETF |
| SHY | iShares Barclays 1-3 Year Tres. Bond ETF |
| IJR | iShares S&P 600 SmallCap Index Fund |
| SPY | SPDR S&P 500 Index ETF Trust |
| TLT | iShares Barclays 20+ Year Treasury Bond ETF |
| GCC | WisdomTree Continuous Commodity Index Fund |
| VOOG | Vanguard S&P 500 Growth ETF |
| VOOV | Vanguard S&P 500 Value ETF |
| EEM | iShares MSCI Emerging Markets ETF |
| XLG | Invesco S&P 500 Top 50 ETF |

| Symbol | Company | Sector | Current Price | Action Price | Target | Stop | Notes |
|---|---|---|---|---|---|---|---|
| ABBV | AbbVie Inc. | Drugs | $219.68 | 210s - low 230s | 284 | 188 | 5 for 5'er, favored DRUG sector, LT pos peer & mkt RS, breakout from consec sell signals, 2.9% yield |
| AB | AllianceBernstein Holding LP | Wall Street | $38.09 | low 40s | 64 | 32 | 3 TA rating, LT mkt RS buy, LT pos trend, top 50% of WALL sector matrix, consec buy signals, buy-on-pullback, yield > 8% |
| ZWS | Zurn Elkay Water Solutions Corp. | Machinery and Tools | $45.73 | hi 40s - lo 50s | 95 | 42 | 5 TA rating, LT pos trend, LT mkt RS buy, consec buy signals, buy-on-pullback |
| CACI | CACI International Inc. | Computers | $606.72 | 570s - 600s | 672 | 528 | 5 for 5'er, top 25% of COMP sector matrix, LT pos mkt RS, triple top breakout |
| WBS | Webster Financial Corporation | Banks | $67.25 | hi 60s - low 70s | 91 | 58 | 4 for 5'er, top 25% of BANK sector matrix, one box from peer RS buy, buy on pullback, 2.2% yield |
| MCK | McKesson Corporation | Drugs | $940.91 | 396-hi 470s | 1304 | 752 | 5 TA rating, top 33% of DRUG sector matrix, LT RS buy, consec buy signals, buy-on-pullback |
| CGON | CG Oncology, Inc. | Biomedics/Genetics | $64.29 | hi 50s - low 60s | 80 | 50 | 5 for 5'er, 18 of 162 in BIOM sector matrix, bullish catapult, good R-R, Earn. 3/26 |
| AZN | Astrazeneca Group PLC Ads (United Kingdom) ADR | Drugs | $189.90 | mid 180s - upper 190s | 236 | 160 | 4 for 5'er, top 25% of DRUG sector matrix, LT pos peer RS, one box from mkt RS buy, bullish triangle |
| RTX | RTX Corp. | Aerospace Airline | $204.52 | upper 190s to mid 210s | 254 | 166 | 4/5'er; top third of Aero matrix; Peer RS within 1 box of RS buy; ATHs on 3/2. |
| COCO | Vita Coco Company, Inc. | Food Beverages/Soap | $58.35 | mid-to-hi 50s | 72 | 48 | 5 for 5'er, top half of FOOD sector matrix, LT pos peer & mkt RS, pos trend flip |
| DGII | Digi International Inc | Telephone | $49.12 | upper 40s to lower 50s | 61 | 40 | 5 for 5'er; top quartile of Telephone matrix; buy signal since May '25, pos. trend since June '25. |
| ASND | Ascendis Pharma A/S | Biomedics/Genetics | $225.98 | 220s - low 230s | 282 | 188 | 4 for 5'er, top third of BIOM sector matrix, LT pos peer & mkt RS, bullish triangle, buy on pullback |
| BRX | Brixmor Property Group Inc | Real Estate | $29.65 | hi 20s - lo 30s | 38 | 24 | 4 for 5'er, top third of REAL sector matrix, LT pos peer & mkt RS, LT pos trend, bullish triangle, 4% yield |
| Symbol | Company | Sector | Current Price | Action Price | Target | Stop | Notes |
|---|---|---|---|---|---|---|---|
| CPRT | Copart Incorporated | Autos and Parts | $34.09 | hi 30s | 28 | 42 | 1 TA rating, bottom 50% of AUTO sector matrix, NT and mkt RS sell last month, consec sell signals |
| Comment | |||||||
|---|---|---|---|---|---|---|---|
|
|
|||||||
BRX Brixmor Property Group Inc R ($30.13) - Real Estate - BRX is a 4 for 5'er that ranks in the top third of the real estate sector matrix and has been on peer and market RS buy signals since 2021 and trading in a positive trend since 2020. On its default chart, BRX has completed three consecutive buy signals, most recently completing a bullish triangle in last week's trading. Long exposure may be added in the upper $20s to lower $30s and we will set our initial stop at $24. Using a modified vertical price objective based on BRX's most recent buy signal, we will set our target price at $38. BRX also carries a 4% yield.
| 21 | 22 | 23 | 24 | 25 | 26 | ||||||||||||||||||||||||
| 30.00 | X | X | Top | 30.00 | |||||||||||||||||||||||||
| 29.00 | B | O | X | 29.00 | |||||||||||||||||||||||||
| 28.00 | 9 | O | 8 | 2 | Mid | 28.00 | |||||||||||||||||||||||
| 27.00 | X | 4 | 8 | 1 | 7 | O | X | 27.00 | |||||||||||||||||||||
| 26.00 | 1 | O | X | O | X | O | X | O | X | 26.00 | |||||||||||||||||||
| 25.00 | B | O | X | O | X | 4 | X | C | Bot | 25.00 | |||||||||||||||||||
| 24.00 | 6 | O | 5 | 8 | 2 | X | 7 | O | X | 24.00 | |||||||||||||||||||
| 23.00 | 5 | O | X | O | X | O | 7 | C | O | X | O | 23.00 | |||||||||||||||||
| 22.00 | 4 | O | 7 | O | B | O | 6 | O | B | O | X | • | 22.00 | ||||||||||||||||
| 21.00 | 3 | 6 | X | 9 | X | 3 | X | O | X | 4 | • | 21.00 | |||||||||||||||||
| 20.00 | X | O | X | O | X | O | X | A | X | • | 20.00 | ||||||||||||||||||
| 19.50 | X | O | O | A | 5 | O | • | 19.50 | |||||||||||||||||||||
| 19.00 | X | O | X | • | 19.00 | ||||||||||||||||||||||||
| 18.50 | X | O | X | • | 18.50 | ||||||||||||||||||||||||
| 18.00 | X | X | O | • | 18.00 | ||||||||||||||||||||||||
| 17.50 | X | X | O | X | • | 17.50 | |||||||||||||||||||||||
| 17.00 | X | O | 1 | O | X | • | 17.00 | ||||||||||||||||||||||
| 16.50 | X | O | X | 2 | • | 16.50 | |||||||||||||||||||||||
| 16.00 | X | O | X | • | 16.00 | ||||||||||||||||||||||||
| 15.50 | X | O | • | 15.50 | |||||||||||||||||||||||||
| 15.00 | X | • | 15.00 | ||||||||||||||||||||||||||
| 14.50 | X | • | 14.50 | ||||||||||||||||||||||||||
| 14.00 | X | • | 14.00 | ||||||||||||||||||||||||||
| 13.50 | • | X | • | 13.50 | |||||||||||||||||||||||||
| 13.00 | • | X | • | • | X | • | 13.00 | ||||||||||||||||||||||
| 12.50 | O | X | O | A | • | B | • | 12.50 | |||||||||||||||||||||
| 12.00 | O | X | O | X | O | X | • | 12.00 | |||||||||||||||||||||
| 11.50 | 9 | O | X | O | X | • | 11.50 | ||||||||||||||||||||||
| 11.00 | O | O | • | 11.00 | |||||||||||||||||||||||||
| 21 | 22 | 23 | 24 | 25 | 26 |
| NVDA NVIDIA Corporation ($182.62) - Semiconductors - NVDA rose Monday to break a double top at $188, marking a second consecutive buy signal and returning the stock to a positive trend. This promotes the stock to a 3 for 5 TA rating. The technical picture is still mixed, as it sits in the bottom half of the favored semiconductors sector matrix and is on a sell signal on its peer RS chart. Initial support can be seen at $180 and $176, with strong support at $170. Overhead resistance is seen initially at $196. |
| ROL Rollins, Inc. ($55.00) - Business Products - For the first time in more than two decades, shares of ROL moved to a negative trend after completing a bearish catapult at $55. The now 4 for 5'er still holds market and peer relative strength for the time being, so it's more of a buy than anything. However, those with exposure should watch for further deterioration. From here, support starts at $54 then $50. |
| STX Seagate Technology ($401.13) - Computers - STX rose Monday to break a double top at $400 before reaching $408 intraday. This 4 for 5'er moved to a positive trend in April 2025 and has been on an RS buy signal against the market since 2023. The stock also sits in the top half of the computers sector RS matrix. The weight of the technical evidence is favorable and improving again. Initial support can be seen at $372 and $344. Overhead resistance may be seen between $424 and $456. |
| WDC Western Digital Corporation ($285.08) - Computers - WDC pushed higher Monday to break a double top at $284 before reaching $288 intraday. This 5 for 5'er moved to a positive trend last May and has maintained an RS buy signal against the market since 2023. The stock also sits in the top third of the computers sector RS matrix. The weight of the technical evidence is favorable and improving. Initial support can be seen at $260 and $240. Further overhead resistance may be seen at $296 and the all-time highs at $308. |

| Name | Option Symbol | Action | Stop Loss |
|---|---|---|---|
| Broadcom Ltd - $324.92 | O: 26E330.00D15 | Buy the May 330.00 calls at 23.15 | 304.00 |
| Name | Option | Action |
|---|---|---|
|
|
||
| Name | Option Symbol | Action | Stop Loss |
|---|---|---|---|
| ARM Holdings PLC ADR - $121.76 | O: 26Q120.00D15 | Buy the May 120.00 puts at 10.35 | 130.00 |
| Name | Option | Action |
|---|---|---|
| General Mills, Inc. ( GIS) | Apr. 45.00 Puts | Raise the option stop loss to 4.50 (CP: 6.50) |
| CBRE Group, Inc. ( CBRE) | Apr. 145.00 Puts | Stopped at 11.20 (CP: 11.00) |
| Enphase Energy Inc ( ENPH) | May. 40.00 Puts | Stopped at 46.00 (CP: 45.72) |
| PepsiCo, Inc. ( PEP) | Jul. 160.00 Puts | Initiate an option stop loss of 8.15 (CP: 10.15) |
| Name | Option Sym. | Call to Sell | Call Price | Investment for 500 Shares | Annual Called Rtn. | Annual Static Rtn. | Downside Protection |
|---|---|---|---|---|---|---|---|
| Iron Mountain Inc. $ 106.84 | O: 26G110.00D17 | Jul. 110.00 | 7.30 | $ 50,744.70 | 21.74% | 17.98% | 5.71% |
| Name | Action |
|---|---|
| Intel Corporation ( INTC) - 45.77 | Sell the May 49.00 Calls. |
| Freeport-McMoRan Inc. ( FCX) - 56.38 | Sell the June 65.00 Calls. |
| Micron Technology, Inc. ( MU) - 426.13 | Sell the June 420.00 Calls. |
| Moderna, Inc. ( MRNA) - 52.56 | Sell the April 55.00 Calls. |
| Fortinet Inc. ( FTNT) - 83.44 | Sell the May 85.00 Calls. |
| Devon Energy Corporation ( DVN) - 46.25 | Sell the June 47.50 Calls. |
| Name | Covered Write |
|---|---|
| CAVA Group, Inc. ( CAVA - 82.00 ) | April 80.00 covered write. |
| DHT Holdings, Inc. ( DHT - 16.85 ) | May 17.00 covered write. |
Daily Equity & Market Analysis
LISTEN TO PODCAST
Mar 12, 2026
NDW MORNING UPDATE
Mar 16, 2026
Loading, Please Wait...
