
Over the past several months, markets have cycled through a variety of themes and regimes. Most recently, leadership has shifted away from many large-cap, growth-oriented areas that previously dominated performance. In an environment where market dynamics can change quickly, having a systematic and adaptive investment process becomes increasingly valuable.
Over the past several months, markets have cycled through a variety of themes and regimes. Most recently, leadership has shifted away from many large-cap, growth-oriented areas that previously dominated performance. In an environment where market dynamics can change quickly, having a systematic and adaptive investment process becomes increasingly valuable.
A few months ago, the NDW team launched several new factor-based strategies, including a comprehensive multi‑factor approach known as the NDW Multifactor Model TR (NDWMULTIFACTOR.TR). This strategy is built on a disciplined, rules‑based framework designed to adapt across changing market environments. The model integrates four distinct factor sub‑models—quality, low volatility, value, and growth—with each sub‑model contributing its top five securities based on proprietary ranking matrices. The result is a well‑diversified portfolio of 20 total holdings that captures multiple sources of return across style factors (Click here to read more). The image below shows the different sub-models that make up the NDW multifactor model.

An important nuance of this approach is that by continuously selecting the highest-ranked securities from each sub-model, the strategy implicitly incorporates momentum as a “hidden” overlay. Securities must demonstrate relative strength against their peers within each factor sub-model, which helps the model stay aligned with evolving market leadership.
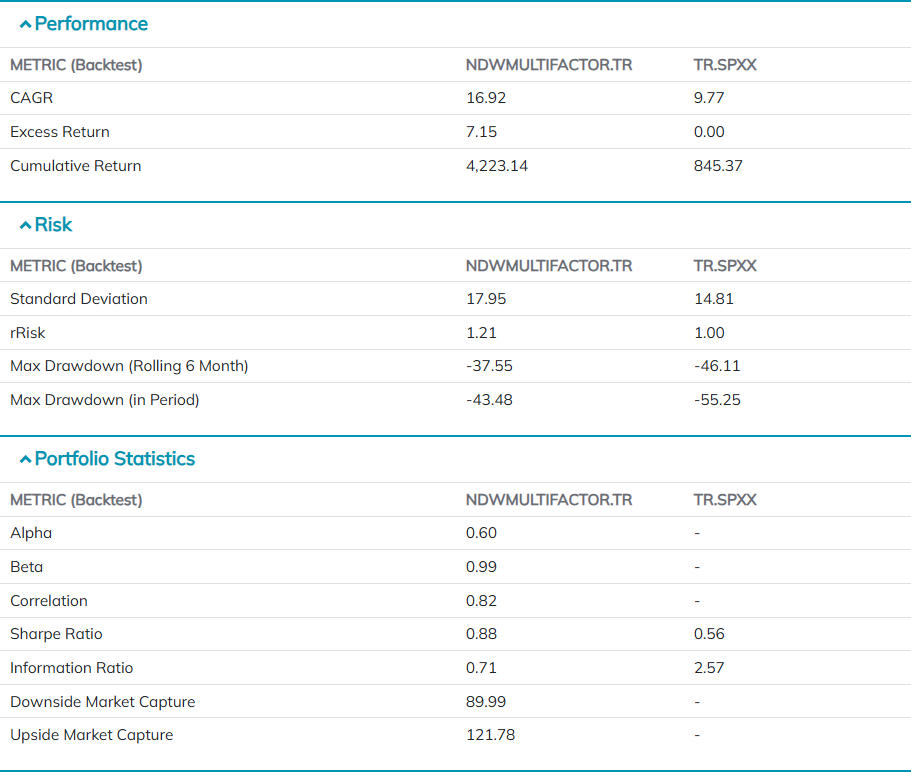
The chart below highlights the NDW Multifactor Model’s performance across multiple time horizons. Year-to-date, the model is up 10.42%, outperforming the S&P 500 Total Return (TR.SPXX) benchmark by more than 12%. Since inception in 2002, the model has delivered an annualized return of over 17%, exceeding its benchmark by over 7%. Notably, the strategy outperforms the benchmark across every time interval shown in the chart.

A deeper look “under the hood” reveals a well-balanced portfolio across market capitalizations (large- and mid-cap) and investment styles (growth, value, and blend). This diversification helps mitigate concentration risk and enhances the model’s ability to perform across different market environments. From a downside-risk perspective, the model has demonstrated strong resilience. Its maximum drawdown of -43.48% is meaningfully less severe than the benchmark’s -55.25%, highlighting improved capital preservation during periods of market stress.
Perhaps most compelling is the model’s Sharpe Ratio, a widely used measure of risk-adjusted returns that evaluates how efficiently a strategy converts risk into performance. The NDW Multifactor Model posts a Sharpe Ratio of 0.88, substantially higher than the benchmark’s 0.56. This indicates that the model has not only generated superior returns but has done so with greater consistency and efficiency.
By combining multiple complementary factors within a disciplined and adaptive framework, the NDW Multifactor Model offers a robust approach for navigating changing market regimes—delivering strong absolute performance, consistent relative outperformance, and attractive risk-adjusted returns over time.
