
Internationals remain towards the top of the overall rankings as we close out Q1 2026. We observe the performance spread between major representatives and how it compares to historical averages.
Amid all of the talk about commodities, markets seem to have forgotten about the overall strength of international equities. While we will need to watch the recent rise of the U.S. Dollar (most recent article linked here), international equities continue to flex their muscles toward the top of the pack on NDW’s broad rankings. The average global/international fund on the Asset Class Group Scores Page has a strong 4.14 (of 6) fund score… and while that metric has fallen off slightly, the overall technical picture for many international groups remains quite strong. Broad ex U.S. representative (ACWX) maintains a superior 5.38 fund score as of 3/18, having advanced roughly 4% so far this year. On its default chart, the fund has reversed back up into Xs providing a level of localized support around $68. While it is closer to testing this support than printing additional upside, the path of least resistance remains higher as the fund sits just under 7% away from its respective chart high at $74. In terms of its relative strength, ACWX returned to a buy signal on its 3.25% RS chart against the equal-weighted S&P 500 SPXEWI in January. The move marked the first buy signal favoring the international representative since 2006- the lone signal that lasted over 2 years until late 2008. While domestic equities have indisputably dominated this RS relationship, a switching strategy that owns whichever asset (SPXEWI or ACWX) is on a RS buy signal is an overall profitable strategy over a buy-and-hold of either asset on its own. While there is no way of telling whether this signal will ultimately last another two years or reverse right back down, it will certainly be something to watch going forward.

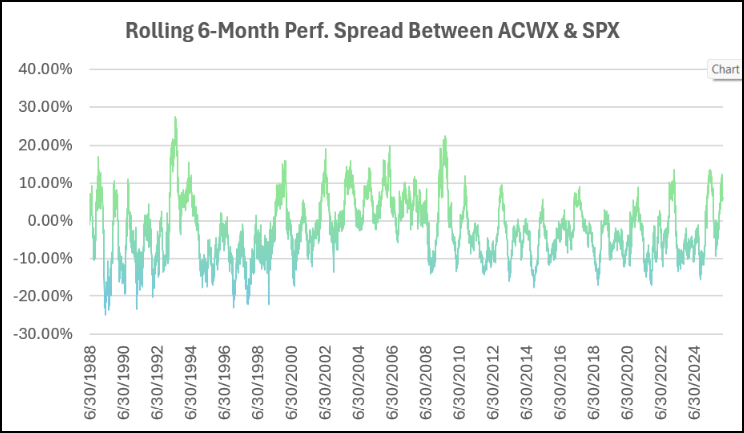
Breaking this relationship down even further, we can utilize a simple rolling six-month performance spread between ACWX and SPX. Through 3/16, ACWX had outperformed broad SPX by just over 6%. While this value may seem insignificant at first glance, it is well above the historical (1998-2026) average that sees SPX best ACWX by roughly 2.5% over any given six-month timeframe. The historical spread is displayed below. A few interesting points to note- you’ll see that outside of the 2000s, sustained, positive (favors ACWX) values have been hard to come by. Other instances throughout the 2010s have rarely risen above 10% before quickly retreating as domestic names took over. While the 2020s have remained somewhat sporadic in terms of overall performance leadership, the magnitude of domestic outperformance has dwindled. So far in the 2020s, SPX has outperformed ACWX over any given 6-month period by roughly 3.5%, compared to nearly 4.5% throughout the 2010’s. While the decade isn’t over yet, this is a meaningful reduction and signals an uptick in relative leadership from international representatives.
To contextualize how the 2020s are shaping up against other decades, we can run a simple count of days in each period that the spread was positive (favoring ACWX). In doing so, we can see that roughly 26% of the days throughout the 2020’s have seen international outperforming domestics over the preceding 6-months… well above the ~17% observed throughout the 2010s. Comparing the count to other periods, it sits roughly on par with our pre-2000 bucket (27.5%) and still well behind what we saw throughout the 2000’s. Remember, we still have quite a ways to go in this decade, but the message here is clear: There is an increasing number of international options that are able to compete with your domestic space.

Remember, the global stage brings with it several risks not quite present when considering suitability on the domestic front. Keep this in mind when going out and finding ideas to plug-and-play in your client portfolios.
