
Your clients are probably interested in picking up energy exposure....but the space is a bit overbought. Today we talk about relative improvements and a handful of stock ideas.
It isn’t always easy to convince yourself to buy something that's up 30% already this year…. But in theory us trend followers certainly could. Having a proper system in place to properly navigate purchase of overbought assets is paramount, as is establishing a checks and balances system to ensure you aren’t in the business of getting whipsawed around when putting new money to work. Lots of research has discussed the uptick for energy focused names, and as the space has backed off of recent highs, we will highlight a large relative strength change worth watching as we close Q1.
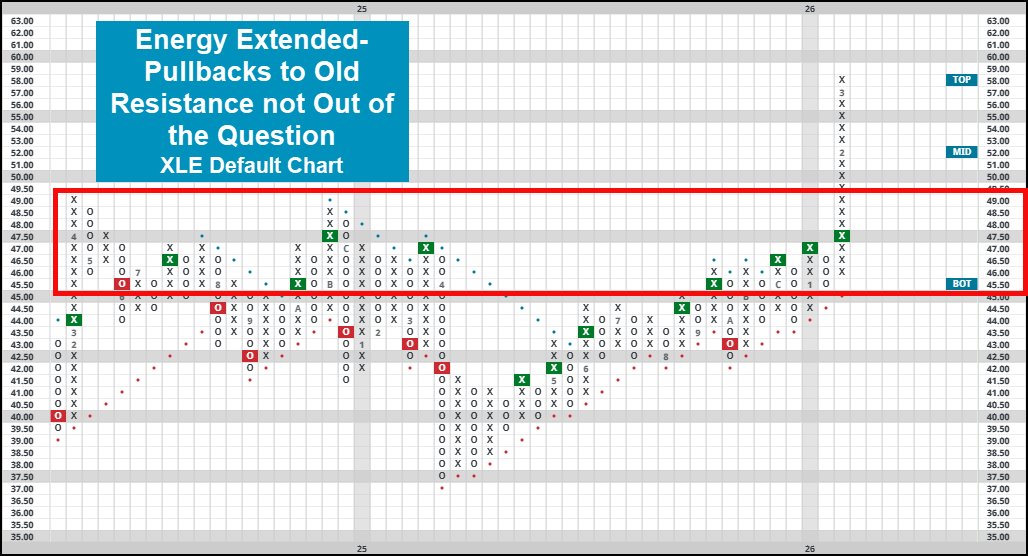
Before doing so, we will offer a brief technical comment for XLE, which has been lifted higher by the storm forwards for crude as unrest in the Middle East surges onwards. Sitting in a string of 17 X’s on its default chart, the overall technical picture for the broad energy fund is certainly extended. Using a more sensitive $.25 scale to help identify more localized levels of support and resistance, pullbacks to the mid-$50’s are certainly not out of the question. On more sustained downside action, a trip back down to a range of old resistance in the mid/upper $40’s would be realistic. It goes without saying that price action in the energy space is currently driven by headlines stemming from the Middle East, but keeping these technical levels in mind can help contextualize movement as it occurs.
As you might expect, the swift upside action for XLE has also led to notable relative improvement against other areas of the market. Specifically, XLE returned to a relative strength (RS) buy signal against the S&P 500 on 3/12. While there have been a fair share of headfakes in the dataset, an investor following an RS Switching strategy (owning whichever asset was on a buy signal) is a historically profitable strategy over a buy and hold of either asset individually. The last instance of this chart moving back to a buy signal was in January of 2022… a year we now know to be historically poor for domestic equites in general. While there is still plenty of time left in 2026, it will be important to watch this chart for further relative action to see if areas outside of the core will continue to lead.

To close today’s piece, we will look underneath the hood of XLE to find four and five attribute stocks that aren’t overbought, of which there are five names (BKR, DVN, EQT, WMB, & XOM). Of this list, the best-looking name is either EQT or XOM. Both of these are high attribute names that maintain their respective buy signals on their default chart. EQT (pictured below) has moved nicely along its bullish support line, sitting at all-time chart highs. Reversals lower could see the 4/5’er head back to the middle of the trading band at $58 and could be a possible entry point for those of you looking to be a bit more defensive with putting new money to work. XOM has backed off of recent highs, establishing support just above the middle of the trading band. Similar reversals to the $146-$148 mark could offer an opportunity to add to existing positions. Remember, the energy space is no stranger to large swings one way or the other, especially when there is unrest on the global stage. Keep this in mind when looking for new names and finding relevant support and resistance points.

