This week’s action has seen continued upside and near-term leadership out of energy funds and stocks.
This week’s action has seen continued upside and near-term leadership out of energy funds and stocks. A little over a week ago, the sector moved to the third position within the NDW DALI Sector Rankings, and this week’s action has brought energy within one signal of basic materials in second. The broader State Street Energy Select Sector SPDR Fund (XLE) continues to trade near last week’s all-time chart highs, while the Invesco S&P Equal Weight Energy ETF (RSPG) improved on recent highs during Thursday’s trading (2/19), rallying above $99.
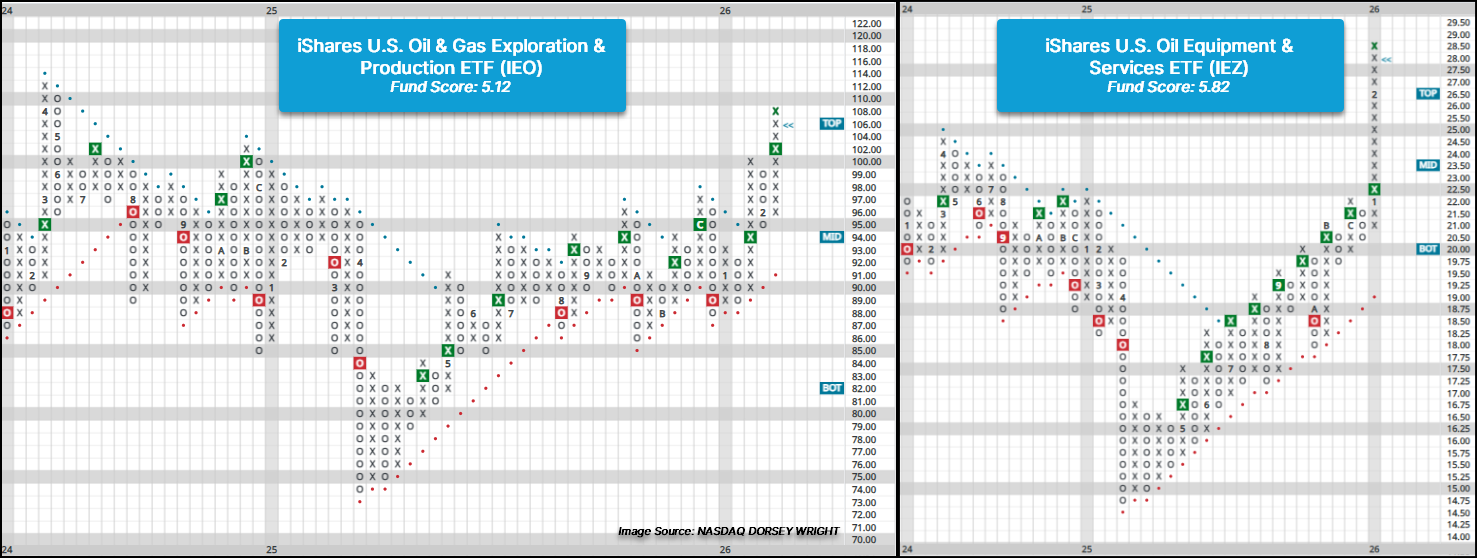
Under the hood of the broader energy sector, the iShares U.S. Oil & Gas Exploration ETF (IEO) and iShares U.S. Oil Equipment & Services (IEZ) has shown notable technical improvement with both rallying to multi-year highs. Thursday’s (2/19) action brought the trend chart of IEO within a couple boxes of its all-time chart high at $112, and the market RS chart returned to a buy signal after having been on an RS sell signal since February 2023. IEO now joins IEZ with a fund score above 5 (out of 6) with IEZ having maintained a market RS buy signal and score above 5 since mid-January. Both ETFs are trading in overbought territory with weekly OBOS readings north of 100%, so those seeking long energy exposure are best to look for a pullback from recent highs down to prior resistance levels before considering. IEO is actionable at $102, while IEZ is action in the $25 range.
Most energy-related ETFs show extended and/or overbought positions on their point and figure trend charts. Energy stocks present a variety of different chart characteristics, but two provide notable examples of the rally witnessed within most.
Like energy funds, Exxon Mobil Corporation (XOM) rallied notably to kick off 2026. After giving a second buy signal in November last year, XOM cleared resistance in the $120s in January before improving to an all-time high in February at $156. Thursday’s action brought the trend chart back into a column of Xs after briefly pulling back last week, indicating price consolidation has begun. With the stock maintaining a 4 technical attribute rating and ranking within the top quintile of the oil sector matrix, XOM is likely one within or potentially being considered for client portfolios. While we look for chart and price consolidation, a normalization of the 10-week trading band is also needed before adding new or additional exposure.
BP has rallied along within the broader sector, giving a second buy signal in January as it has rallied to $39. Unlike Exxon though, BP didn’t rally to new highs and has notable resistance in the $40 to $41 range. BP maintains a 4 technical attribute rating due to superior market RS and a positive trend and ranks within the top half of the oil sector matrix while yielding north of 5%. While short-term holders may look to lock in a profit with the rally, resistance in play likely warrants patience for long-term holders. A move above resistance signals potential for further upside and would develop long-term support.
Stocks with similar chart action to XOM and BP could have similar approaches, but should there be any questions, feel free to reach out to the analyst team.

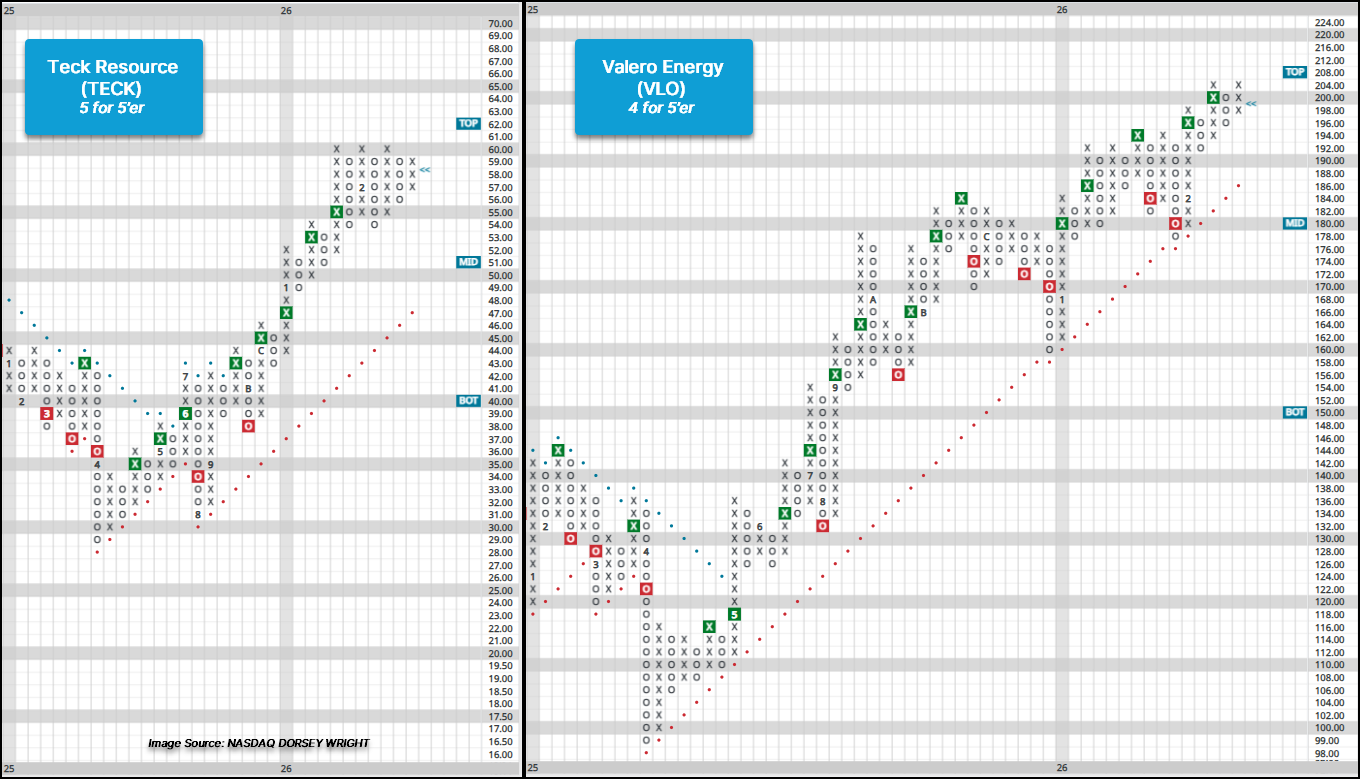
Though it may seem there is a lack of actionable energy ideas, they’re out there. Two potential options are Teck Resources (TECK) and Valero Energy (VLO), both of which rank within the top half of the oil services sector matrix. TECK has been a 5 for 5’er since seeing its peer RS chart give an RS buy signal in the latter part of January, while VLO has maintained a 4 TA rating since July last year. TECK has consolidated during February’s trading and is currently actionable in the mid $50 to $60 range, while VLO broke out of a brief consolidation to kick off February and is actionable at current prices.
To cull out other potential ideas within the energy sector, NDW users can utilize the screener tool to search for 4 and 5 technical attribute names that maintain a positive long-term trend and reside within actionable territory (Weekly OBOS ~ 70% or less) on their 10-week trading band.