Most Requested Symbols

With optimism fading, what are some common gauges of investor outlook, and what do they say about our current market environment?
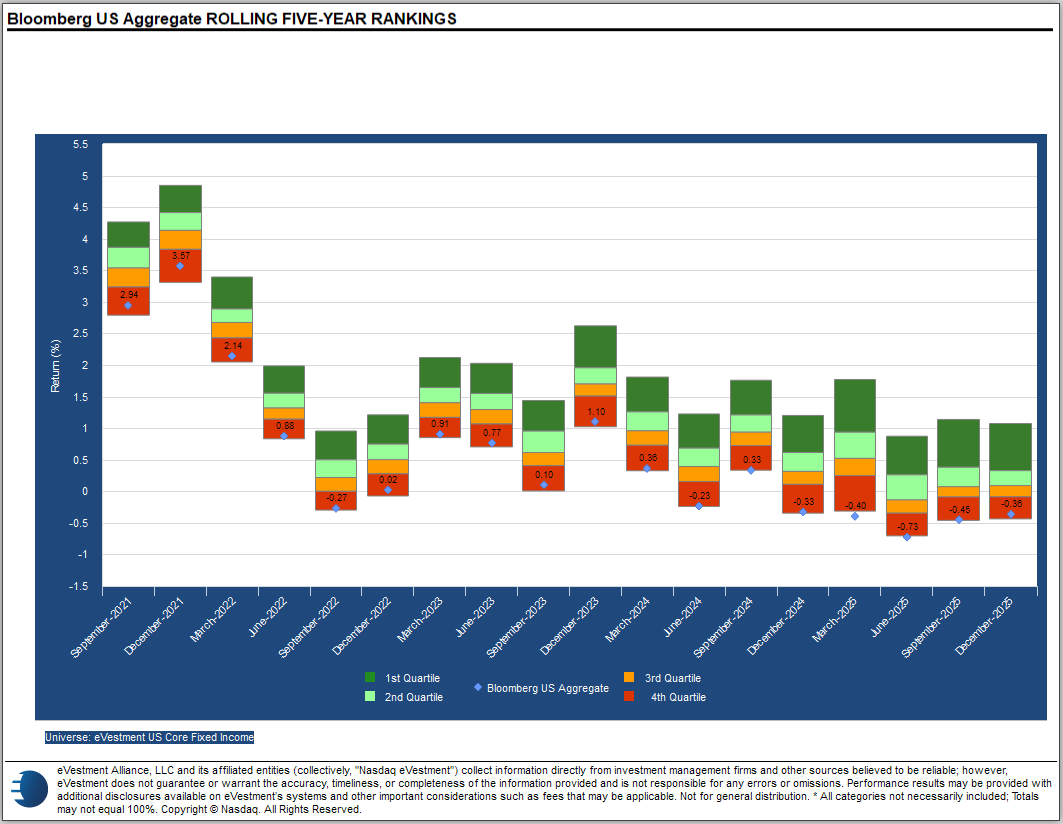
Active managers continue to outperform in fixed income markets.
Weekly Rundown Video – Feb 18, 2026
Weekly rundown with NDW analyst team covering all major asset classes.
Weekly rundown with NDW analyst team covering all major asset classes.
Domestic equities have slowed down over the last month, while a steady stream of negative headlines has provided daily reasons to sell, causing general market sentiment to decline. With optimism fading, what are some common gauges of investor outlook, and what do they say about our current market environment?
The most common “fear gauge” of the stock market is the CBOE VIX index, measuring the expected volatility (standard deviation or returns) of the S&P 500 over the next 30 days. With the market pulling back slightly from all-time highs, the VIX has ticked higher in recent months. It currently sits around 20, only slightly above its long‑term average of 19.6, suggesting conditions are not yet even mildly abnormal. However, the VIX hasn’t been the only indicator to deteriorate in recent weeks.

Another way to evaluate sentiment is to compare how many investors think the market will rise versus to how many think it will fall. The AAII sentiment survey does precisely that, asking investors whether they expect the market to rise, fall, or remain flat over the next six months. The AAII Survey Bull-Bear Spread (AAIISPREAD) subtracts the percentage of bearish respondents from the percentage that are bullish to gauge overall sentiment. A positive reading indicates more bulls than bears, while a negative reading suggests the opposite. To start the year, AAIISpread moved above 20, marking its highest reading since 2024. With the market cooling off since then, sentiment has turned negative for the first time in nearly three months. That said, this recent shift isn’t a reason to panic by itself.

The market actually performs better when more investors are bearish. Specifically, the S&P 500 averages a one-year total return of 12.4% when there are more bears than bulls, but that number falls to 8.7% when the AAIISpread is positive. There are a mere 2.4% more bears than bulls right now, so our market outlook shouldn’t change drastically based on the recent move. However, the overall trend gives us less reason to be concerned over a drop in sentiment. That said, there are other long-term sentiment indicators worth monitoring closely.
When it comes to monitoring risk, there’ an old Wall Street adage: “credit leads, equity follows.” Among the most important measures of risk aversion is the 10yr corporate high yield spread (CBUS10YRSPREAD), measuring the extra yield demanded by investors on corporate high yield bonds relative to US Treasuries. A widening spread usually reflects rising uncertainty, while a tightening spread indicates increasing economic confidence.
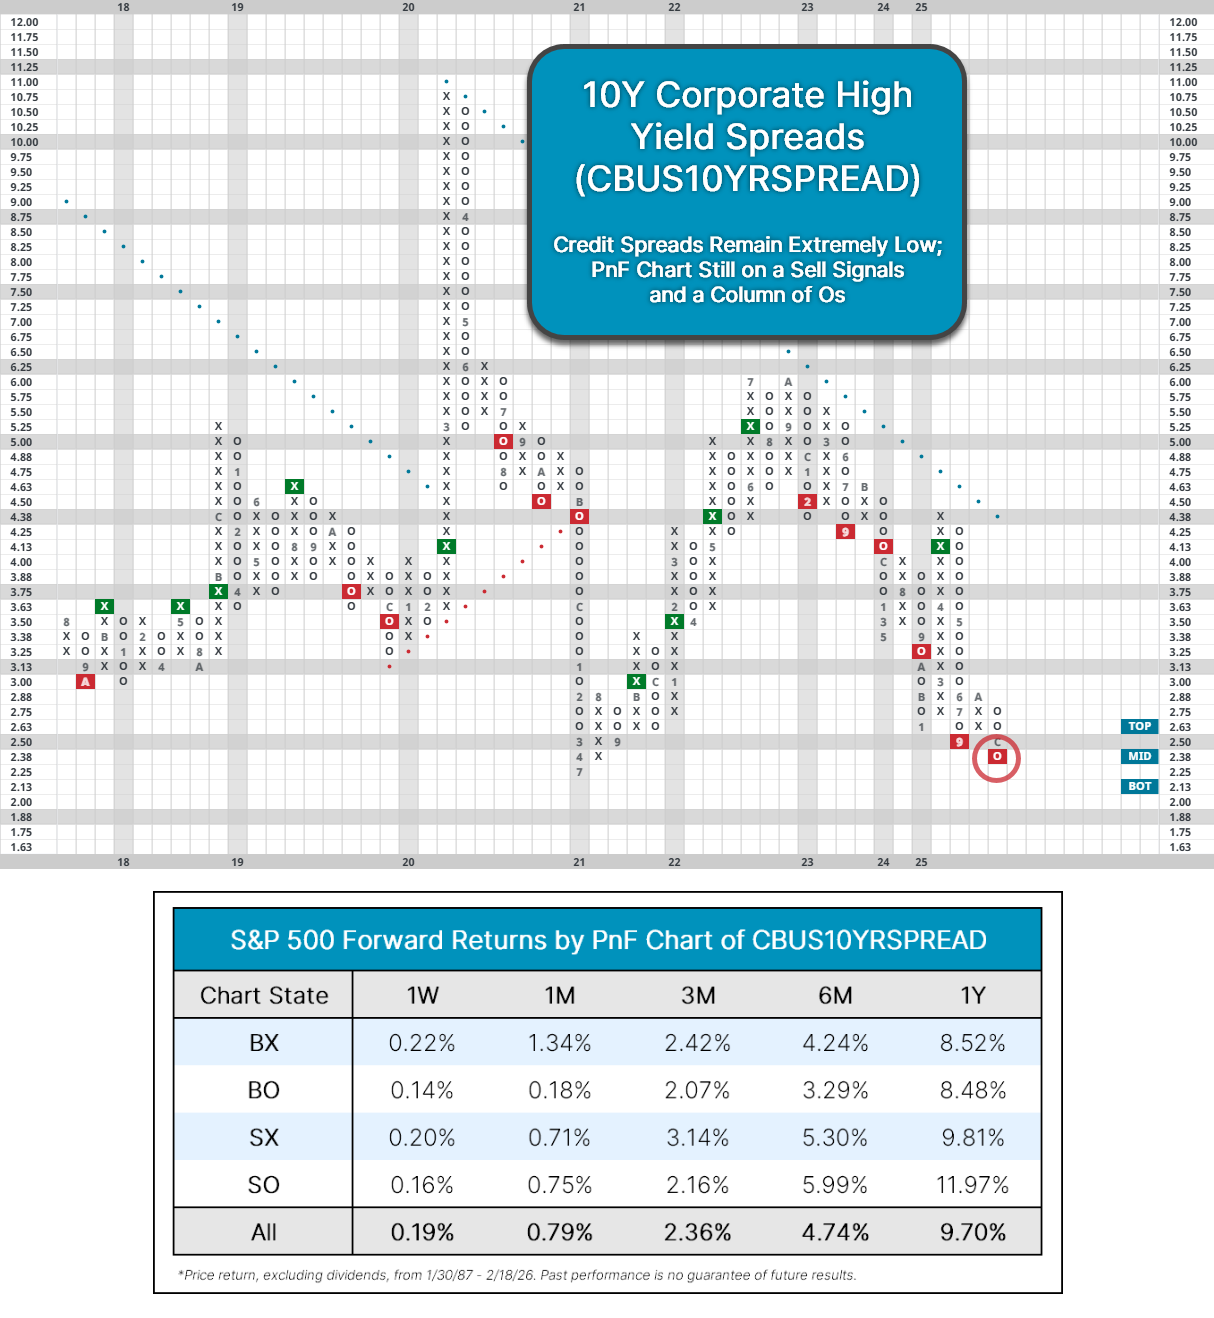
Credit spreads continue to trade at historically low levels below 2.5%, and CBUS10YRSPREAD still trades on a sell signal and a column of Os, despite a slight uptick YTD. Unlike the VIX or sentiment surveys, spreads have yet to materially change. That’s a positive sign not only for bonds but also for equities. Going back to 1987, the S&P 500 averages a one-year return of 12% when the 10yr spread is on a sell signal and a column of Os like it is now, which bodes well for our current environment. Overall, the decline in sentiment isn’t too concerning yet, but indicators like credit spreads are worth monitoring in case conditions materially shift.

Last week, we updated our review of active vs. passive management – a look at which management style has an advantage on a market-by-market basis. As regular readers of this report already know, our most recent review showed what has long been the case – of the various markets we reviewed, fixed income has had the most consistent bias favoring active management. If the performance advantage, in and of itself, was not reason enough to favor active over passive management in fixed income, there are other issues with passive bond indexes that may make active management a more suitable choice. The problems with passive fixed income provide a potential win for you as an advisor – informing your clients about the pitfalls of passive fixed, your plan to avoid them, and then selecting actively managed strategies for their portfolios in a market where the passive benchmark routinely underperforms most active managers.
For our discussion of the problems with passive fixed income, we will focus on the Bloomberg Barclays US Aggregate Bond Index (LBUSTRUU) as it is perhaps the most ubiquitous passive bond index in the world. However, the potential pitfalls discussed herein are not unique to the AGG Index and pertain to most, if not all, passive bond indices with similar construction methodologies.
Performance
As we’ve already mentioned, performance is one of the major drawbacks of passively managed fixed income. While the S&P 500 (SPX) has been a very difficult benchmark for stock pickers over the last decade, the US Agg has consistently lagged most active fixed income managers, meaning that investors who have chosen an Agg-tracking fund over a passive strategy have likely sacrificed performance.
Your Exposure Can Materially Change Without You Doing Anything
Unlike the major equity indices, which usually have stable constituencies from year to year, the composition of bond indices changes much more frequently. Whereas the S&P 500 and the Russell 1000 (RUI) are updated quarterly and annually, respectively, the composition of the Bloomberg Barclays US Aggregate Index changes monthly. The iShares Core U.S. Aggregate Bond ETF (AGG), for instance, had a turnover of 81% for the 12-month period ending February 28, 2025; meanwhile, the SPDR S&P 500 ETF (SPY) had a turnover of just 3% for the 12 months ending 9/20/25.
Why should the average investor care about the more frequent rebalances and higher turnover of fixed income indices? With about 7% of the holdings in the Aggregate Bond ETF changing every month on average, exposure a fixed income portfolio can change quickly and it can happen under the surface, i.e., without an advisor or client seeing any trades in the portfolio. While this is often viewed as a primary benefit of the ETF product structure, it may not be as advantageous if you don’t realize it’s happening or understand the impact of the changes. Unless the client is looking at the exposure breakdown of the index every month, they could find that the exposure in the indexed bond ETF they bought six months ago looks very different than the exposure it brings to the portfolio today.
The “Bums” Problem
The fast-changing nature of fixed income indices we discussed above also contributes to the “bums” problem. As with equity indices, many fixed income indices are essentially market cap weighted. In equity indices, market cap weighting means that the most historically successful companies (at least in terms of increasing their market value) become the most heavily weighted. In a market cap-weighted fixed income index, the most heavily weighted entities are those that have issued the most debt. This presents a problem for the buyer of a cap-weighted fixed income index, as they will be most heavily exposed to the most debt-laden and not necessarily the most creditworthy of issuers. Apple (AAPL) has been a star of the US equity market for two decades and maintained an enviable credit rating for many years but only had its first bond issuance in 2013. As such, despite being one of the largest companies in the world, AAPL couldn’t have been included in fixed income funds before that time.
Furthermore, unlike equity indices which typically include only corporations, issuers within fixed income indices can include corporations, states and municipalities, and sovereign governments. Heavily indebted sovereign governments present a unique challenge as they can (and at various points have) simply dec.de to cease payments on their notes, leaving debtholders with limited recourse.
The “bums” problem can be mitigated by utilizing another weighting schema, e.g., equal weighting, but this can introduce new problems, such as a heavier weighting toward thinly traded, illiquid issues. And so, many bond funds employ some form of market cap weighting, and the impacts of this are quite different than we find within the US equities.
Passive Bond Indexes Can Become Riskier at the Worst Time
You’re undoubtedly aware that prior to 2022 we had been in an ultra-low interest rate environment for many years and a declining rate environment for far longer still. That trend has shifted, but among the effects of the years of low-interest rates is that the bond market itself has become riskier.
Since 2009, the duration of the US AGG Index has increased from around 3.5 years to around six years. For the bond aficionados out there, this suggests that a 1% move higher in the yield curve today would cause a corresponding decline in bond valuations of about 2.5% more than a similar rate move back in 2009.
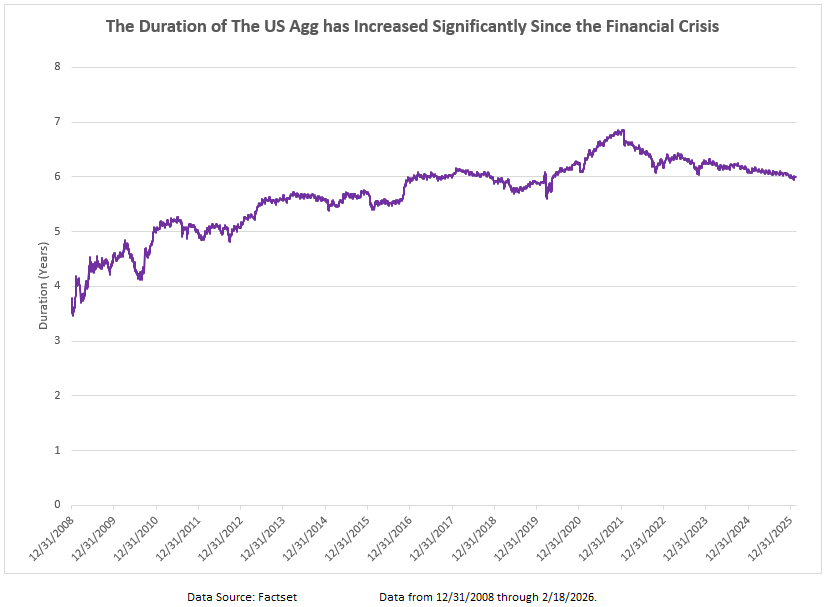
This is caused, again, by passive bond portfolios investing in a market that hasn’t itself remained “passive”. Although the duration risk of the AGG has improved moderately in the last couple of years as higher interest rates have pushed coupons higher and made long-term debt less attractive, the core market remains significantly more sensitive to rate movements than it was prior to the financial crisis and this shift in risk happened under the surface of AGG-tracking funds. While there are additions to deletions to equity indexes, if you own SPY you probably have a pretty good idea of what your exposure is, even if you haven’t recently reviewed a holdings list. However, in the case of a passive fixed income fund, the exposure could have materially shifted since you added it to your client’s portfolio.
Developing a Strategy
In our estimation, a market like fixed income - where active management has a record of outperformance and the exposure of passive funds can change under the surface – is an ideal environment for a tactical approach. Currently, the fixed income rankings in the Asset Class Group Scores favor convertible bonds and non-US exposure while many “core” groups (which comprise the US Agg) sit toward the bottom of the rankings. But this is not a static situation. There will almost certainly come point when long-term yields decline, rewarding the duration exposure of the core, and if that decline is due to a slowing economy, segments of the market with high credit risk, like high yield corporates could experience significant declines. Tactical strategies will attempt to navigate these potential shifts by allocating toward strength in the market.
Tactical fixed income strategies are available both as separately managed accounts and guided models on the NDW platform. If you would like to discuss tactical managed account solutions please contact Andy Hyer at AndyH@dorseymm.com or (626)535-0630.
If you are interested in implementing a guided model we have several options available on the platform including:
Each of these models are rules-based, relative strength-guided methodologies capable of providing rotation within the fixed income asset class. Each model employs a unique investment inventory that dictates both the boundaries by which it may concentrate exposure and the markets it may utilize. Collectively, they offer solutions for fixed income sleeves within a larger portfolio or can be part of a core-satellite strategy that uses low-cost indexing as well.
Average Level
37.54
| < - -100 | -100 - -80 | -80 - -60 | -60 - -40 | -40 - -20 | -20 - 0 | 0 - 20 | 20 - 40 | 40 - 60 | 60 - 80 | 80 - 100 | 100 - > |
|---|---|---|---|---|---|---|---|---|---|---|---|
|
Sell signallqd
|
|||||||||||
|
Sell signalief
|
|||||||||||
|
Buy signalijr
|
|||||||||||
|
Buy signaltlt
|
Buy signalIJH
|
||||||||||
|
Sell signalONEQ
|
Buy signalfxe
|
Buy signaliwm
|
Buy signalGLD
|
Buy signalgsg
|
Buy signalEEM
|
||||||
|
Sell signalVOOG
|
Sell signaldx/y
|
Buy signalgcc
|
Buy signaldia
|
Buy signalVOOV
|
Buy signalrsp
|
Buy signaldvy
|
|||||
|
Buy signalXLG
|
Buy signalQQQ
|
Buy signalSPY
|
Buy signalhyg
|
Buy signalshy
|
Buy signalagg
|
Buy signaluso
|
Buy signalicf
|
Buy signalefa
|
|||
| < - -100 | -100 - -80 | -80 - -60 | -60 - -40 | -40 - -20 | -20 - 0 | 0 - 20 | 20 - 40 | 40 - 60 | 60 - 80 | 80 - 100 | 100 - > |
| AGG | iShares US Core Bond ETF |
| USO | United States Oil Fund |
| DIA | SPDR Dow Jones Industrial Average ETF |
| DVY | iShares Dow Jones Select Dividend Index ETF |
| DX/Y | NYCE U.S.Dollar Index Spot |
| EFA | iShares MSCI EAFE ETF |
| FXE | Invesco CurrencyShares Euro Trust |
| GLD | SPDR Gold Trust |
| GSG | iShares S&P GSCI Commodity-Indexed Trust |
| HYG | iShares iBoxx $ High Yield Corporate Bond ETF |
| ICF | iShares Cohen & Steers Realty ETF |
| IEF | iShares Barclays 7-10 Yr. Tres. Bond ETF |
| LQD | iShares iBoxx $ Investment Grade Corp. Bond ETF |
| IJH | iShares S&P 400 MidCap Index Fund |
| ONEQ | Fidelity Nasdaq Composite Index Track |
| QQQ | Invesco QQQ Trust |
| RSP | Invesco S&P 500 Equal Weight ETF |
| IWM | iShares Russell 2000 Index ETF |
| SHY | iShares Barclays 1-3 Year Tres. Bond ETF |
| IJR | iShares S&P 600 SmallCap Index Fund |
| SPY | SPDR S&P 500 Index ETF Trust |
| TLT | iShares Barclays 20+ Year Treasury Bond ETF |
| GCC | WisdomTree Continuous Commodity Index Fund |
| VOOG | Vanguard S&P 500 Growth ETF |
| VOOV | Vanguard S&P 500 Value ETF |
| EEM | iShares MSCI Emerging Markets ETF |
| XLG | Invesco S&P 500 Top 50 ETF |

| Symbol | Company | Sector | Current Price | Action Price | Target | Stop | Notes |
|---|---|---|---|---|---|---|---|
| JPM | J.P. Morgan Chase & Co. | Banks | $308.78 | lo 300s - mid 320s | 380 | 256 | 5 TA rating, top 25% of favored BANK sector matrix, LT RS buy, LT pos trend, buy-on-pullback |
| EWBC | East West Bancorp, Inc. | Banks | $121.72 | mid 100s - mid 110s | 157 | 92 | 4 for 5'er, top third of favored BANK sector matrix, LT pos peer RS, one box from mkt RS buy, spread quad top |
| APTV | Aptiv PLC | Autos and Parts | $83.81 | hi 70s - low 80s | 100 | 69 | 5 for 5'er, top half of AUTO sector matrix, successful trend line test |
| GS | Goldman Sachs Group, Inc. | Wall Street | $933.73 | mid-800s - mid-900s | 1416 | 736 | 5 TA rating, top 10% of WALL sector matrix, LT RS buy, LT pos trend, buy-on-pullback |
| PHM | PulteGroup, Inc. | Building | $142.10 | hi 120s - mid 130s | 168 | 110 | 4 for 5'er, top half of BUIL sector matrix, LT pos peer & mkt RS, bullish catapult |
| CBOE | CBOE Global Markets Inc. | Wall Street | $285.69 | lo 260s - mid 280s | 332 | 228 | 5 TA rating, top 25% of WALL sector matrix, LT RS buy, LT pos trend, buy-on-pullback |
| DAL | Delta Air Lines Inc. | Aerospace Airline | $71.11 | mid-to-hi 60s | 99 | 55 | 4 for 5'er, top half of AERO sector matrix, LT pos mkt RS, triple top, buy on pullback |
| JBL | Jabil Circuit, Inc. | Electronics | $260.54 | mid 240s- lo 270s | 352 | 204 | 4 TA rating, top 50% of ELEC sector matrix, LT RS buy, buy-on-pullback |
| ABBV | AbbVie Inc. | Drugs | $228.72 | 210s - low 230s | 284 | 188 | 5 for 5'er, favored DRUG sector, LT pos peer & mkt RS, breakout from consec sell signals, 2.9% yield |
| AB | AllianceBernstein Holding LP | Wall Street | $41.09 | low 40s | 64 | 32 | 4 TA rating, LT mkt RS buy, LT pos trend, top 50% of WALL sector matrix, consec buy signals, buy-on-pullback, yield > 8% |
| Symbol | Company | Sector | Current Price | Action Price | Target | Stop | Notes |
|---|
| Comment | |||||||
|---|---|---|---|---|---|---|---|
|
|
|||||||
AB AllianceBernstein Holding LP ($40.64) R - Wall Street - AB has a 4 for 5 TA rating and sits in the top half of the wall street sector RS matrix. The stock has maintained an RS buy signal against the market since 2021 and been in a positive trend since 2024. The recent chart action saw AB notch a second consecutive buy signal in January before retracting back from multi-year highs this month. AB also offers a yield exceeding 8%. Exposure may be considered on this pullback in the low $40s. Our initial stop will be positioned at $32, which would violate multiple support levels and move the stock to a negative trend. The bullish price objective of $64 will serve as our price target, offering a reward-to-risk of about 3 to 1.
| 23 | 24 | 25 | 26 | ||||||||||||||||||||||||||
| 45.00 | 8 | • | 45.00 | ||||||||||||||||||||||||||
| 44.00 | • | X | O | • | X | 44.00 | |||||||||||||||||||||||
| 43.00 | X | • | X | O | • | • | X | X | O | 43.00 | |||||||||||||||||||
| 42.00 | X | O | X | 9 | X | • | 7 | O | C | X | O | 42.00 | |||||||||||||||||
| 41.00 | X | O | X | O | X | X | O | • | 2 | X | O | B | O | X | 2 | 41.00 | |||||||||||||
| 40.00 | 7 | • | O | X | O | 2 | O | • | X | O | 5 | 8 | X | O | X | O | Mid | 40.00 | |||||||||||
| 39.00 | • | O | B | O | X | O | • | X | O | 4 | X | O | X | O | X | 39.00 | |||||||||||||
| 38.00 | • | O | X | C | X | 3 | • | X | 1 | O | X | O | X | 9 | 1 | • | 38.00 | ||||||||||||
| 37.00 | O | X | O | X | O | 4 | • | X | O | X | O | X | O | X | • | 37.00 | |||||||||||||
| 36.00 | O | X | O | 1 | O | X | O | • | A | O | X | O | X | O | X | • | 36.00 | ||||||||||||
| 35.00 | O | X | O | X | O | X | O | 3 | X | C | O | O | X | • | 35.00 | ||||||||||||||
| 34.00 | A | X | O | X | O | O | X | O | X | O | X | • | Bot | 34.00 | |||||||||||||||
| 33.00 | O | X | O | 5 | 9 | 1 | O | X | O | • | 33.00 | ||||||||||||||||||
| 32.00 | O | 6 | X | O | X | 8 | X | • | • | 32.00 | |||||||||||||||||||
| 31.00 | 8 | X | O | X | O | • | 31.00 | ||||||||||||||||||||||
| 30.00 | O | A | C | • | 30.00 | ||||||||||||||||||||||||
| 29.00 | O | X | • | 29.00 | |||||||||||||||||||||||||
| 28.00 | O | X | • | 28.00 | |||||||||||||||||||||||||
| 27.00 | B | X | • | 27.00 | |||||||||||||||||||||||||
| 26.00 | O | • | 26.00 | ||||||||||||||||||||||||||
| 23 | 24 | 25 | 26 |
| EAT Brinker International Inc ($154.43) - Restaurants - EAT reversed into Os and broke a double bottom at $156 for a second sell signal as shares fell to $154. The stock still maintains a 3 technical attribute rating and ranks within the top quintile of the Restaurants sector matrix. Support lies at current chart levels, while additional lies in the mid to low $140s. |
| EQT EQT Corporation ($59.37) - Oil - EQT gave a second consecutive buy signal and returned to a positive trend Thursday when it broke a double top at $60. The positive trend change will promote the stock to an acceptable 3 for 5'er. From here, the next level of resistance sits at $62, EQT's all-time high. Meanwhile, support can be found at $56. |
| FDX FedEx Corporation ($383.14) - Aerospace Airline - FDX continues to trend higher, returning to all time chart highs with action on the 19th. It is now well into heavily overbought territory, so we should be waiting for a bit of normalization to add to positions. Pullbacks to newly established support at $368 aren't out of the question from here, but tread lightly as past that support isn't found until the low $300's. Regardless, the path of least resistance is higher, we are now more concerned about finding the "right" price. |
| PAAS Pan American Silver Corp ($61.33) - Precious Metals - PAAS returned to a buy signal Thursday when it broke a double top at $59 and continued higher to $61, where it now sits against resistance. Thursday's move adds to an already positive technical picture as PAAS is a 4 for 5'er that ranks in the top half of the precious metals sector matrix. |
| RS Reliance Inc. ($324.78) - Steel/Iron - RS fell to a sell signal Thursday when it broke a double bottom at $320. The outlook for the stock remains modestly favorable as RS is a 3 for 5'er. However, from here, the stock shows no further support on its default chart until $288, more than 10% away from Thursday's close. |
| WLK Westlake Corp. ($95.27) - Chemicals - WLK fell to a sell signal Thursday when it broke a triple bottom $96. The outlook for the stock remains modestly positive as WLK is a 3 for 5'er that ranks 12th of 45 names in the chemicals sector matrix. From here, the next level of support sits at $91. |

| Name | Option Symbol | Action | Stop Loss |
|---|---|---|---|
| Citigroup, Inc. - $115.53 | C2615E120 | Buy the May 120.00 calls at 8.45 | 108.00 |
| Name | Option | Action |
|---|---|---|
| Aptiv PLC ( APTV) | May. 82.50 Calls | Stopped at 6.20 (CP: 5.40) |
| RTX Corp. ( RTX) | May. 200.00 Calls | Raise the option stop loss to 13.25 (CP: 15.25) |
| Name | Option Symbol | Action | Stop Loss |
|---|---|---|---|
| T-Mobile US Inc. - $214.04 | TMUS2615Q210 | Buy the May 210.00 puts at 10.10 | 240.00 |
| Name | Option | Action |
|---|---|---|
| Occidental Petroleum Corporation ( OXY) | May. 47.50 Puts | Stopped at 51.00 (CP: 52.10) |
| Name | Option Sym. | Call to Sell | Call Price | Investment for 500 Shares | Annual Called Rtn. | Annual Static Rtn. | Downside Protection |
|---|---|---|---|---|---|---|---|
| Freeport-McMoRan Inc. $ 62.55 | FCX2618F65 | Jun. 65.00 | 5.65 | $ 28,609.20 | 38.06% | 26.43% | 7.99% |
| Name | Action |
|---|---|
| Alcoa Inc. ( AA) - 60.21 | Sell the March 60.00 Calls. |
| Intel Corporation ( INTC) - 45.46 | Sell the May 49.00 Calls. |
| The Gap, Inc. ( GAP) - 28.02 | Sell the March 29.00 Calls. |
| Enphase Energy Inc ( ENPH) - 46.04 | Sell the April 50.00 Calls. |
| Target Corporation ( TGT) - 115.66 | Sell the May 115.00 Calls. |
| Delta Air Lines Inc. ( DAL) - 71.11 | Sell the April 70.00 Calls. |
| nVent Electric plc ( NVT) - 115.65 | Sell the April 115.00 Calls. |
| Name | Covered Write |
|---|---|
| Invesco PLC ( IVZ - 26.74 ) | April 27.00 covered write. |
Daily Equity & Market Analysis
NDW MORNING UPDATE
Feb 20, 2026
Loading, Please Wait...
