As market leadership rotated away from growth-driven areas, one defensive area showing meaningful improvement has been dividend‑oriented equities
Beginners Series Webinar: Join us on Monday, February 9th at 2 PM (ET) for our NDW Beginners Series Webinar. This week's topic is: Idea Generation with Stocks and Funds Register Here
The new year opened with several of the largest indices extending the strong performance trends seen in recent years. Yet as market leadership rotated away from growth-driven areas toward more defensive segments, many of the prior “risk-on” leaders have lost some momentum. This shift is evident in domestic equities dropping to second place within our DALI asset class rankings and the technology sector transitioning into equal-weight territory in our sector rankings. In contrast, one defensive area showing meaningful improvement early in 2026 has been dividend‑oriented equities.
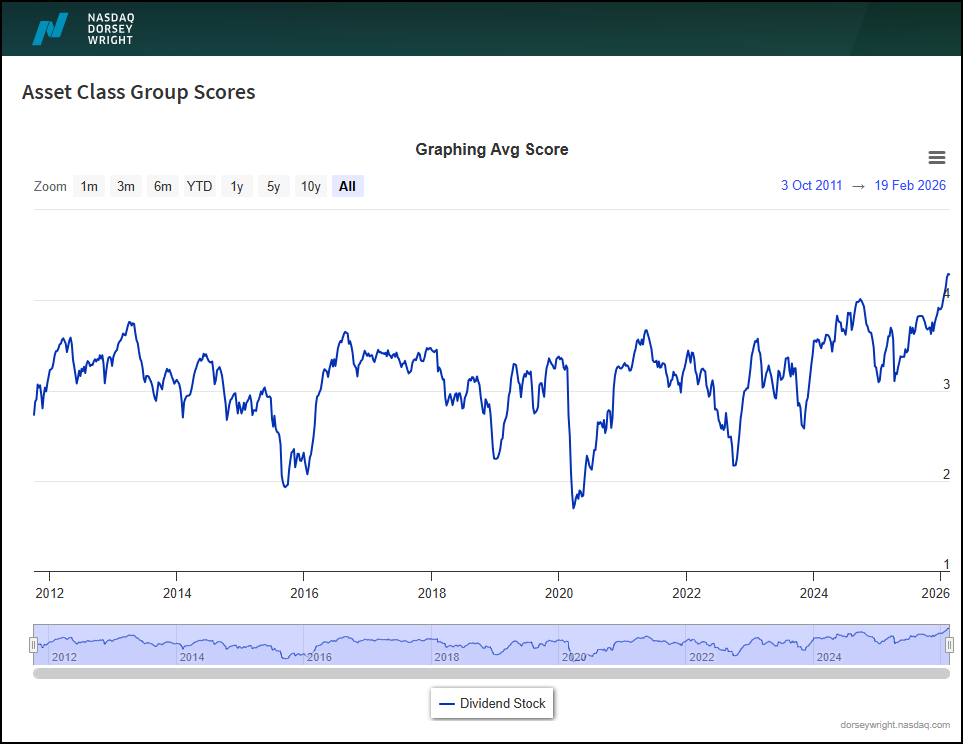
For context, dividend-paying stocks are generally characterized as mature companies, with a consistent history of proven earnings ability and strong cash flows. On a factor-basis, these typically fall under “low-volatility” and “value-oriented” factors, given the nature of their business. The Asset Class Group Scores (ACGS) page offers a great tool to gauge the performance of several groups, along with a historical time-series of how that group has performed over time. On the ACGS page, the “Dividend Stock” has been on quite the run in recent months. The group currently maintains an average score of 4.27, placing it above the 75th percentile in terms of ranking on that page. As shown in the image below, the dividend stock group crossed above 4.0 for the second time since 2011 (when the group was added on the ACGS page). Since crossing above 4.0, the group’s average score has continued to climb higher, as it now maintains readings in all-time high territory.
There are several approaches that can be used to gain exposure into dividend-paying areas. One approach includes using the NDW Yield Portfolio (SPX500YLD) model found in our “Model Lists” page. The portfolio is created by using the highest dividend yielding stocks in the S&P 500 and utilizes our NDW relative strength matrix methodology. As per the rules, the model buys stocks that:
- Are in the top 10 of the matrix
- Maintain a technical attribute score of at least a 3 (>=3)
- Currently trade on a PnF buy signal
For a position to be sold, the stock must
- Fall to the 21st position or below in the matrix
- Fall below a technical attribute score of 3
- Or trade on two consecutives sell signals
Year-to-date, the model has outperformed the S&P 500 (SPX) benchmark by over 8%. Additionally, when looking at the 5-year performance, the model has outperformed by north of 1.5% year-over-year. As a nuance, this performance figure does not include the “total return” of the model. Which, if accounted for, would yield a higher performance figure by several hundred basis points (current yield on model= 3.88%). Altogether, this makes the model a practical tool for investors seeking to incorporate high-yield equities into their asset-allocation strategy.

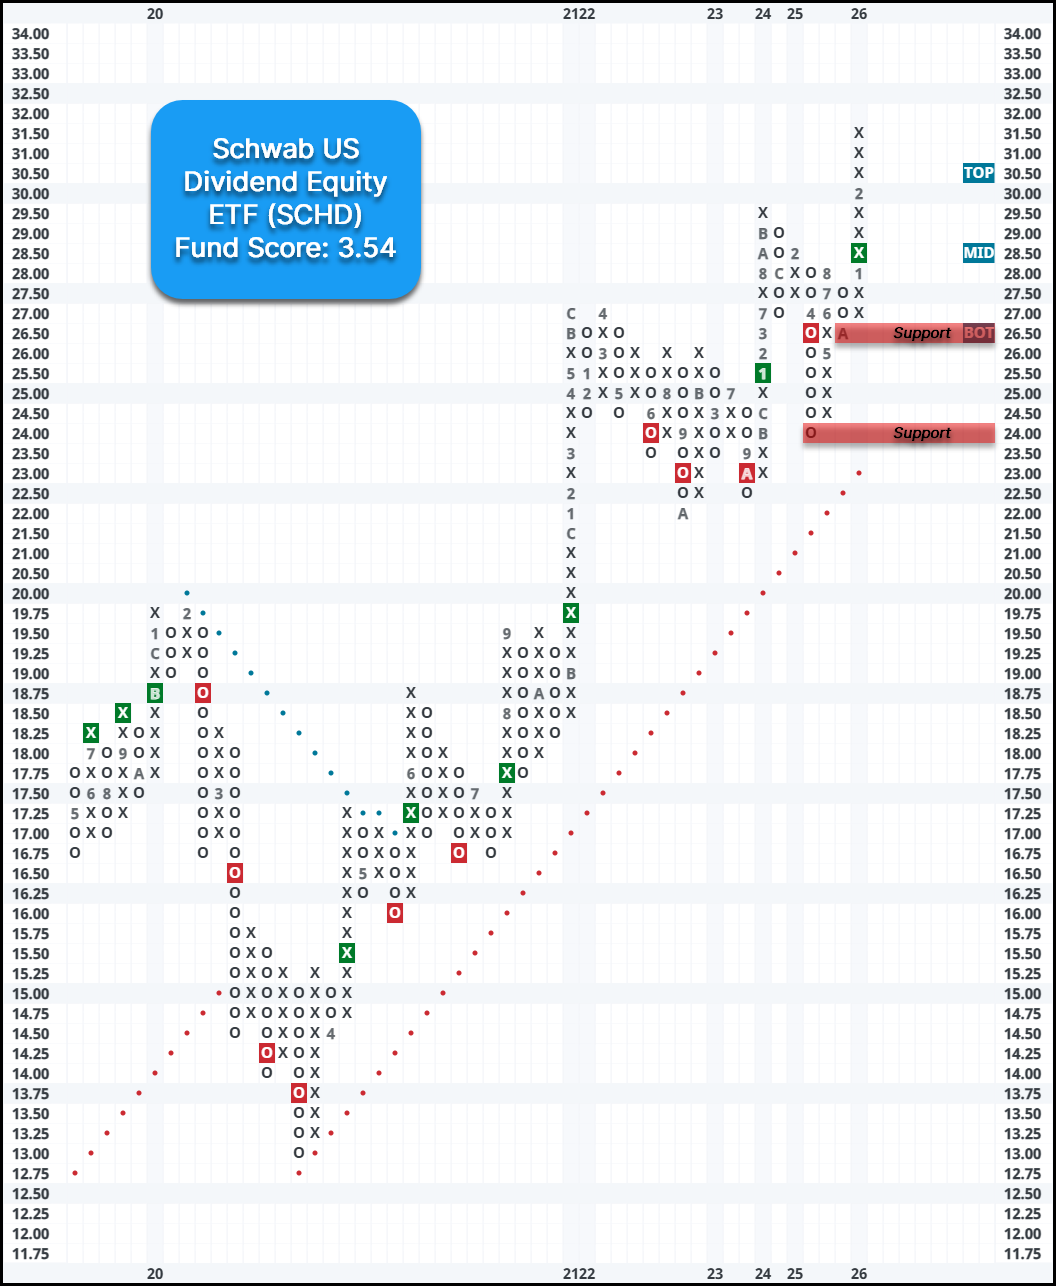
For those who are more interested in simply using an ETF to gain exposure, you could consider using the Schwab US Dividend Equity ETF (SCHD), which provides exposure to high-yielding U.S. dividend-paying stocks with a minimum of 10 consecutive years of dividend payments. The fund reversed back to a buy signal after completing a double top break at $28.50 last month. SCHD maintains a technically acceptable fund score of 3.54 with a notable score direction of 1.70, highlighting its improvement in recent months. Year-to-date (YTD), the fund is up over 15% and ~5.9% in February alone. Additionally, the fund offers an impressive yield of 3.5%. The weekly OBOS indicates that the fund is in overbought territory, so wait for the 10-week trading band to normalize before considering. Initial support is at $26.50, with additional support at $24 dating back to mid-2025.