
With optimism fading, what are some common gauges of investor outlook, and what do they say about our current market environment?
Domestic equities have slowed down over the last month, while a steady stream of negative headlines has provided daily reasons to sell, causing general market sentiment to decline. With optimism fading, what are some common gauges of investor outlook, and what do they say about our current market environment?
The most common “fear gauge” of the stock market is the CBOE VIX index, measuring the expected volatility (standard deviation or returns) of the S&P 500 over the next 30 days. With the market pulling back slightly from all-time highs, the VIX has ticked higher in recent months. It currently sits around 20, only slightly above its long‑term average of 19.6, suggesting conditions are not yet even mildly abnormal. However, the VIX hasn’t been the only indicator to deteriorate in recent weeks.

Another way to evaluate sentiment is to compare how many investors think the market will rise versus to how many think it will fall. The AAII sentiment survey does precisely that, asking investors whether they expect the market to rise, fall, or remain flat over the next six months. The AAII Survey Bull-Bear Spread (AAIISPREAD) subtracts the percentage of bearish respondents from the percentage that are bullish to gauge overall sentiment. A positive reading indicates more bulls than bears, while a negative reading suggests the opposite. To start the year, AAIISpread moved above 20, marking its highest reading since 2024. With the market cooling off since then, sentiment has turned negative for the first time in nearly three months. That said, this recent shift isn’t a reason to panic by itself.

The market actually performs better when more investors are bearish. Specifically, the S&P 500 averages a one-year total return of 12.4% when there are more bears than bulls, but that number falls to 8.7% when the AAIISpread is positive. There are a mere 2.4% more bears than bulls right now, so our market outlook shouldn’t change drastically based on the recent move. However, the overall trend gives us less reason to be concerned over a drop in sentiment. That said, there are other long-term sentiment indicators worth monitoring closely.
When it comes to monitoring risk, there’ an old Wall Street adage: “credit leads, equity follows.” Among the most important measures of risk aversion is the 10yr corporate high yield spread (CBUS10YRSPREAD), measuring the extra yield demanded by investors on corporate high yield bonds relative to US Treasuries. A widening spread usually reflects rising uncertainty, while a tightening spread indicates increasing economic confidence.
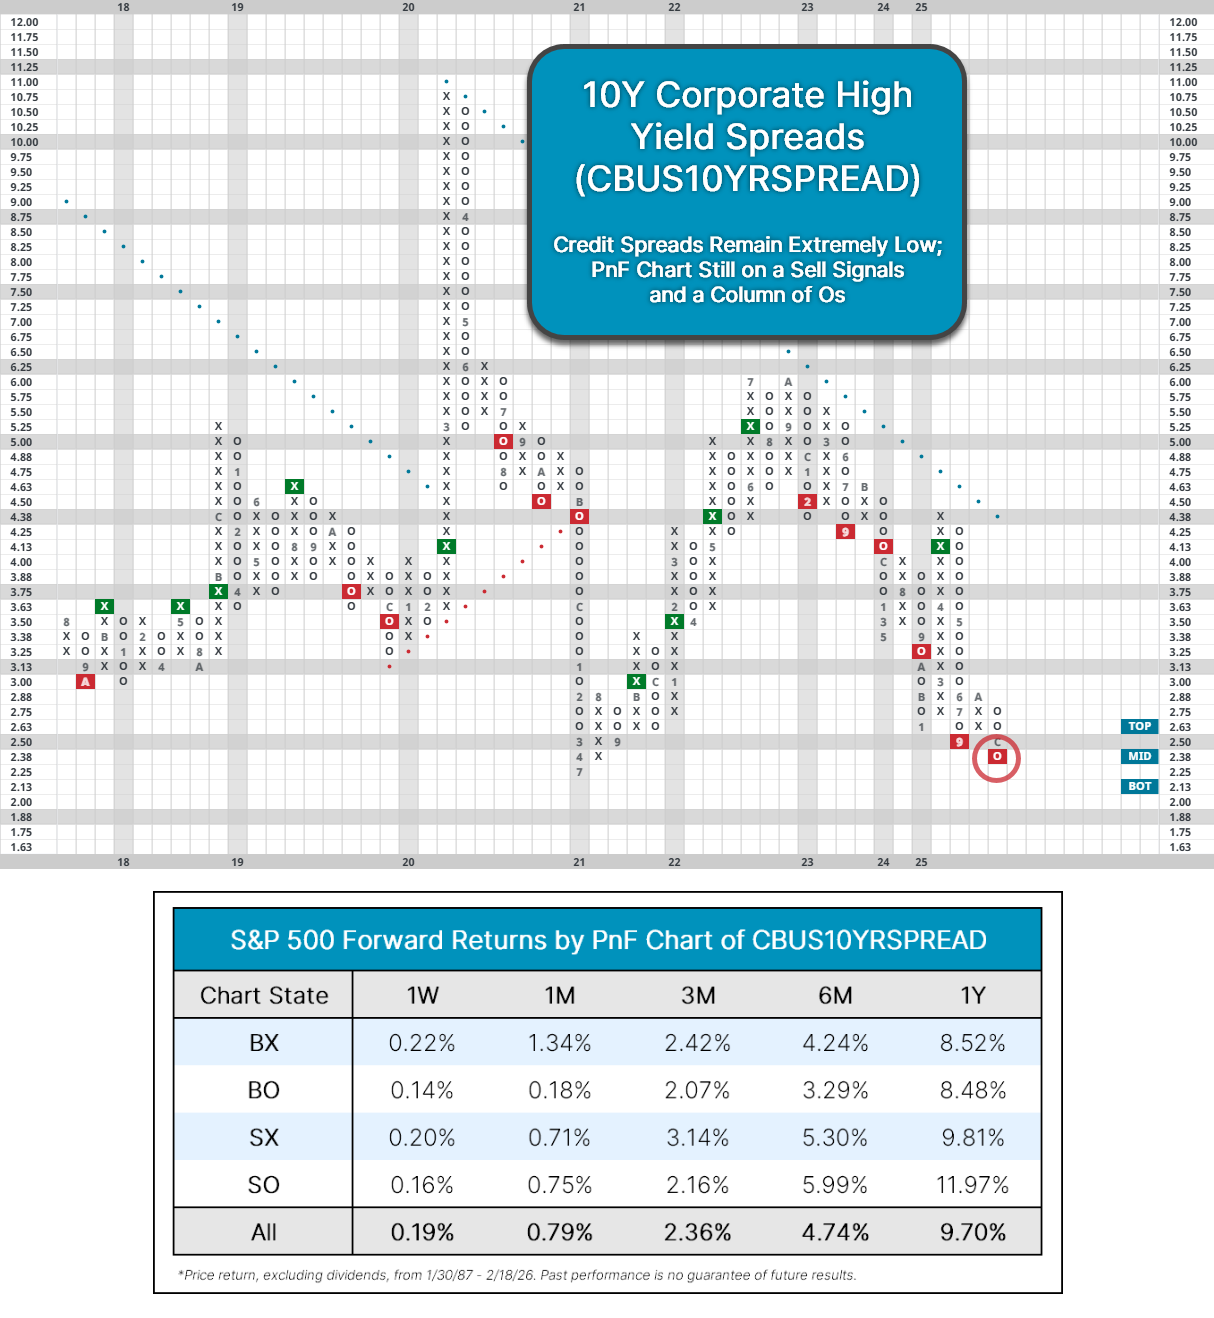
Credit spreads continue to trade at historically low levels below 2.5%, and CBUS10YRSPREAD still trades on a sell signal and a column of Os, despite a slight uptick YTD. Unlike the VIX or sentiment surveys, spreads have yet to materially change. That’s a positive sign not only for bonds but also for equities. Going back to 1987, the S&P 500 averages a one-year return of 12% when the 10yr spread is on a sell signal and a column of Os like it is now, which bodes well for our current environment. Overall, the decline in sentiment isn’t too concerning yet, but indicators like credit spreads are worth monitoring in case conditions materially shift.
