
The iShares Silver Trust ([SLV]) has pulled back more than 35% from its closing high of $105.57.
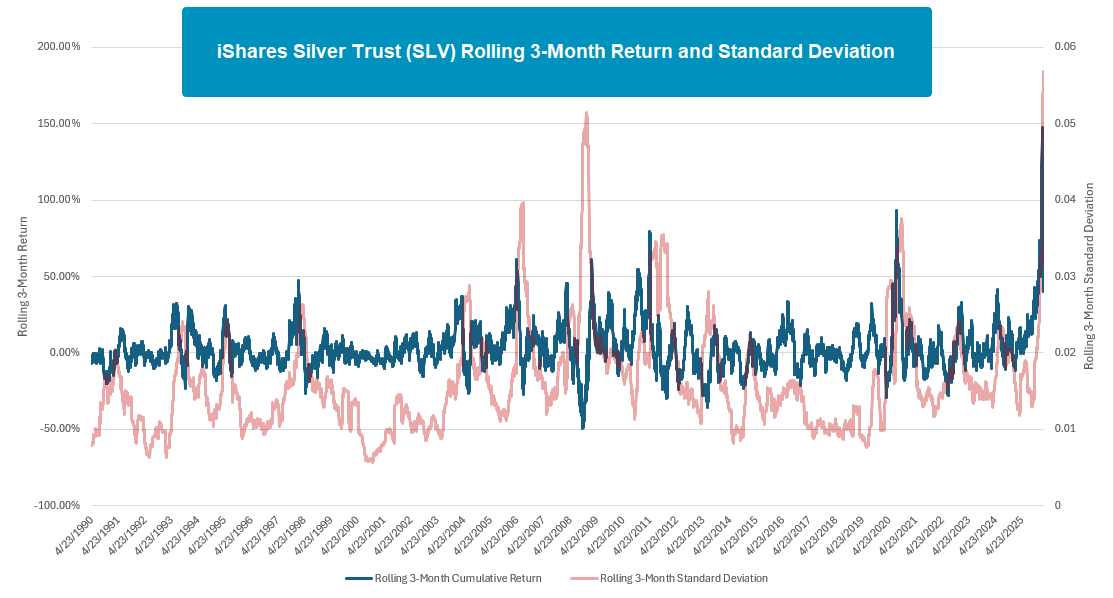
The iShares Silver Trust (SLV) has pulled back more than 35% from its closing high of $105.57. However, SLV is still up nearly 50% over the last three months. In fact, SLV’s rolling 3-month return peaked at 144% at the end of January, its best 3-month return with data going back to 1990. Volatility has continued to stay elevated with SLV’s rolling 3-month standard deviation hitting a new all-time high in our dataset. The previous all-time for the 3-month standard deviation was in December 2008, so current moves in silver are unprecedented over the last 35 years. This amount of daily movement is usually associated with a top or a bottom, at least for the next few months. In any case, it’s extremely likely that silver continues to move like it has over the past few months, and that usually relates to a retrace of the move that caused the volatility. While we have already seen that play out over the last two weeks, SLV’s bullish support line and next area big support is down at $45, another 32% lower.
Digging into the SLV’s chart, it trades on four consecutive sell signals but is barely trading in oversold territory which speaks to the level of volatility in recent months. Perhaps the most glaring feature of the chart is the support area being built in the mid-60s. This was initially established in the run-up phase when 2025 bled into 2026. The support area has been tested twice this month and held both times, so its importance has been emphasized. As mentioned earlier, below the mid-60s, there is no established support until $45, so a break could quickly bring on more downside. Daily swings remain volatile, but the tide has shifted to favor sellers in the short-term, so holders should be wary of any further deterioration.

