We take today's feature to visit the models page and take a look under the hood at a few models that are doing well so far in 2026.
The “sort by YTD performance” buttons on the models page is one of the most clicked features on the NDW platform. While most of us agree that simply using models that are working right now isn’t part of a prudent investment process… it can certainly be quite tempting to “take a peak” at which of the models are doing the best. After all, as trend followers, we are taught to follow what is working, so keeping tabs on different models and their performance can seem quite relevant. With the understanding that it might not be the best practice to sort by performance (but many of us do it anyway…) we will take today’s feature to discuss models that are doing quite well so far this year. Do note, this commentary doesn’t consider client suitability, nor does it intend to focus on any specific universe (or fund provider) in particular. It’s also worth mentioning that just because a model had a strong start to the year does not guarantee further dominance in 2026. Trends are always shifting which could impact performance.
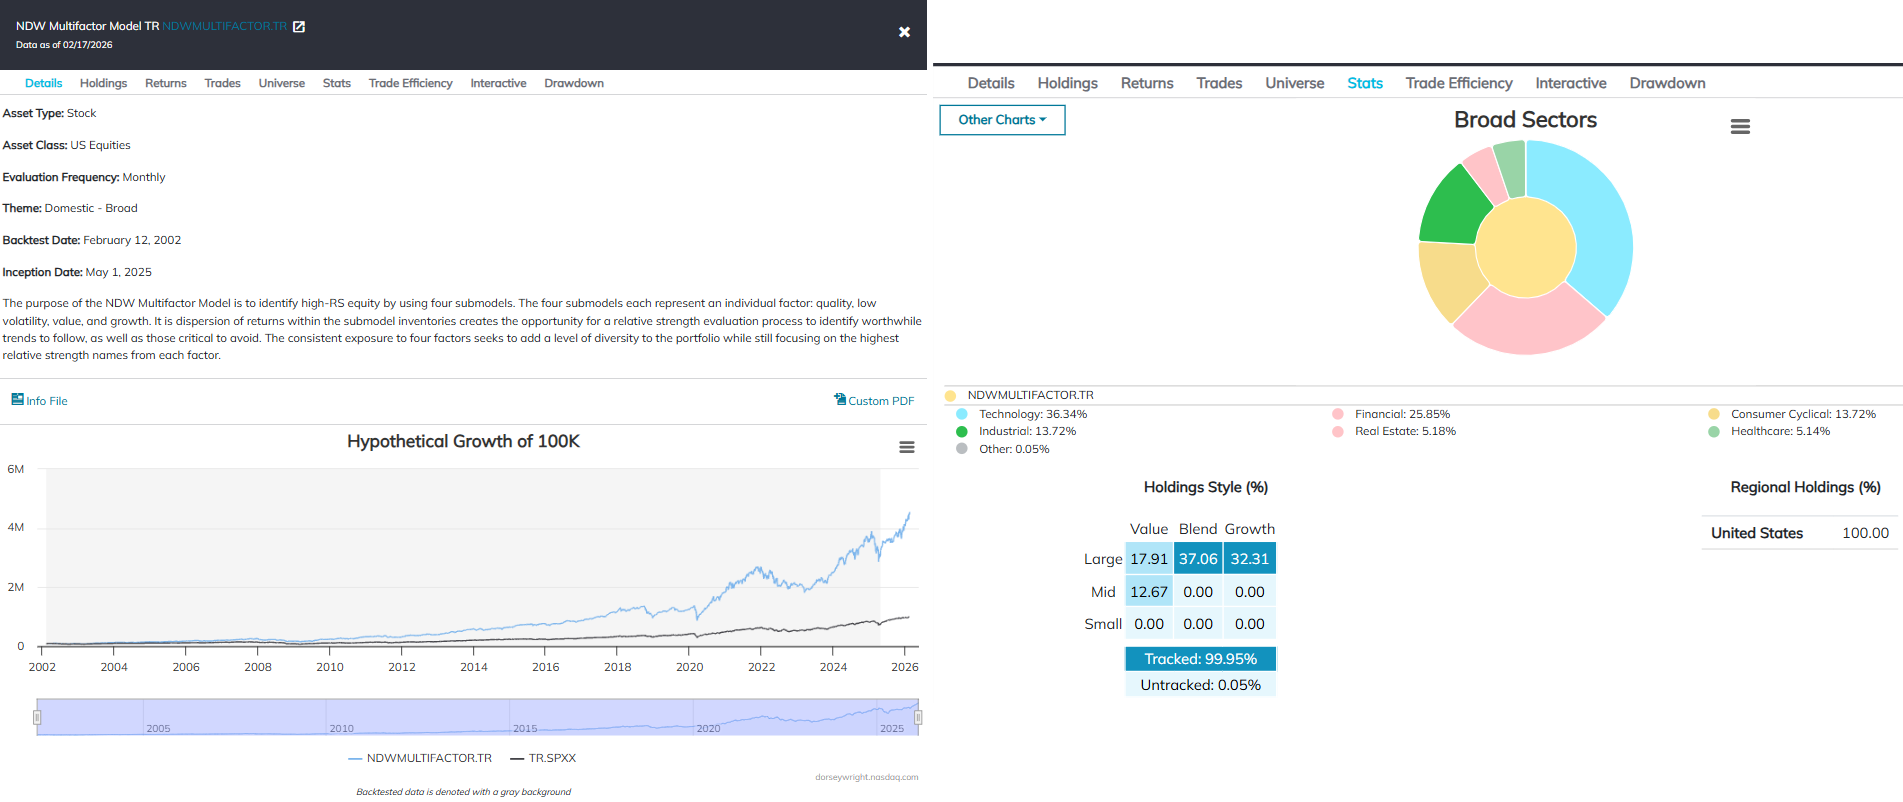
While they might be some of the better performing models this year, we will skip over some of the more “niche” options that focus on individual sectors or countries. Do note, however, that these narrower models can present what we call around the office “high-octane” performance profiles… out/under performance can expand quickly as relative strength trend shift. Regardless, the first of these “non-narrow” options we will highlight is the NDW Multifactor Model, included below. Up nearly 12% so far this year, the model bests its benchmark (TR.SPXX) handily, as the market is roughly flat at the time of this writing. In terms of overall methodology/strategy, the model offers a unique combination of four other factor models discussed in more detail here. In short, the 20 holding model brings in relative strength names from the quality, low vol., value, & growth factors (five from each factor) in an equal weighted fashion. The model maintains heavy allocations towards technology (MU, STX), financials (BK) and industrials (HWM) but the underlying matrix methodology remains flexible to adjust to other areas as needed. It is also worth noting that those of you looking to focus more on any specific factor are welcome to blend together each respective underlying model via the custom modeler static allocation tool. All in all, the multi-factor model presents an opportunity to maintain exposure to growth oriented areas while expanding allocation into other factors in the event of continued core/growth focused relative weakness in 2026.
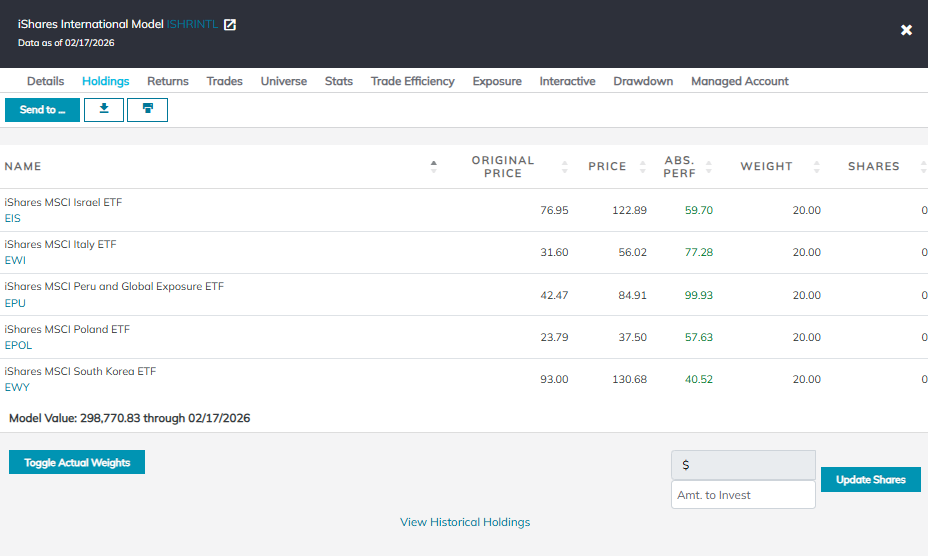
International models remain standouts as the group continues to improve within the NDW rankings. Momentum strategies across the globe remain quite strong as leadership trends appear somewhat consistent, evidenced by the iShares International Model. Up nearly 15% this year, ISHRINTL is nearly doubling its benchmark so far in 2026. The model looks to build off an exceptional 2025, during which it gained ~54% (+27% over its EFA benchmark). In terms of overall methodology, the model utilizes a suite of iShares country specific funds and looks to own the top-five relative strength names until they fall sufficiently out of favor within the matrix. Underneath the hood, holdings include Israel EIS, Italy EWI, Peru EPU, Poland EPOL & South Korea EWY. The model has yet to make a trade in 2026, speaking to the rather persistent strength from international leaders this year. Do keep in mind some of the holdings are somewhat extended… a point to keep in mind when considering near-term exposure.
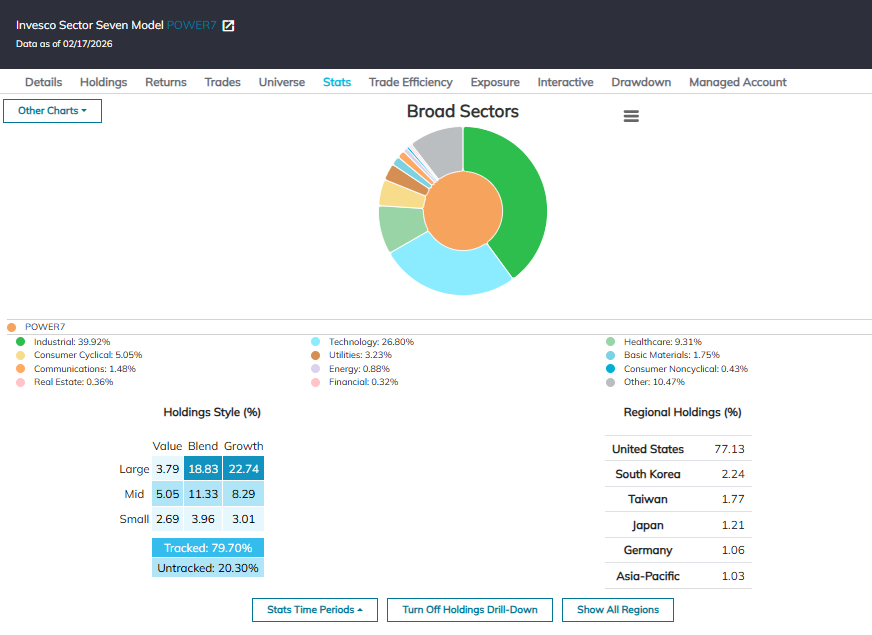
Our last highlight will call out the strong start for the year for the Invesco Sector Seven Model. While the jury is still out on whether or not there is a sustained shift from the likes of technology and communication services leadership underway, the growing number of sectors outperforming the broad market does lead to more interest in sector rotation strategies. The model uses a matrix methodology to select the top seven relative strength leaders from an Invesco sector lineup. Having gained roughly 12.5%, POWER7 is beating the S&P 500 which is roughly flat for the year. Underneath the hood, the model is focused on Aerospace & Defense, Building and Construction, Clean Energy, Next Gen Connectivity, Semiconductors and Pharmaceuticals. Trades this year include moves away from both internet and media & gaming, adding to the weight of the evidence for a larger rotation away from tech focused areas. Further statistics are included below.
While trends could always shift, momentum strategies seem to (largely) be on strong footing right now. Domestically, other areas besides the core doing well should continue to be a tailwind for areas which can properly tilt to new strength as it emerges. On the international front, a continuously weakening dollar remains a major boost for global names- a plus for momentum strategies which can focus on major points of strength. If you have questions about how models can fit into your overall portfolio, feel free to reach out to miles.clark@nasdaq.com