
Analyzing this week's breakouts and breakdowns within Dow-related stocks.
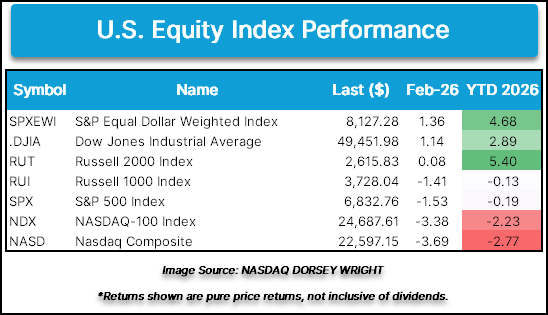
February has provided an intriguing dispersion when considering U.S. equity index performance with the Dow Jones Industrial Average (.DJIA) and S&P 500 Equal Weight (SPXEWI) up over 1%, while the Nasdaq-100 (NDX) and Nasdaq Composite (NASD) are down more than 3%. Technology’s recent descent has been a primary theme for the Nasdaq indices, but the ‘other 493’ along with some notable non-tech related mega caps have assisted the Dow and S&P 500 Equal Weight in their recent performance and rally to all-time chart highs during this week’s trading.
Among the stocks within the Dow 30 to also rally to new highs this week trading were Honeywell (HON) (on 2/10), Walmart (WMT), Caterpillar (CAT), Johnson & Johnson (JNJ), McDonald’s (MCD), and Coca-Cola (KO) (all on 2/12). While not quite reaching all-time highs, Chevron (CVX) sits within one box of the all-time chart high from November 2022. Additional positive action has been witnessed from 3M (MMM), Merck (MRK), and Verizon (VZ) reaching 52-week highs, while names like Home Depot (HD) Procter & Gamble (PG), and Sherwin-Williams (SHW) breaking past near-term resistance.
While the 13 aforementioned stocks provided positive contribution to the Dow index, there were a handful of notable breakdowns. Likely the two most noteworthy breaks came from Amazon (AMZN) and International Business Machine (IBM) as technical deterioration accompanied their moves lower.
Amazon (AMZN) kicked off the month of February reversing lower before earnings last week brought the stock back to a sell signal, ending a series of buy signals that began back in April 2025 as shares fell to just above $200. The magnitude of the post-earnings move brought the market RS chart against the S&P 500 Equal Weight Index (SPXEWI) back to a column of Os and to an RS sell signal after having been on a market RS buy signal since September 2023. This week’s action witnessed shares dip below $198 on the point and figure chart, violating the bullish support line and dropping the stock to a 1 for 5’er in technical attribute rating. This brings the stock to its lowest technical attribute rating since early 2023 and the default chart its lowest level since May 2025. While support resides at current chart levels, additional can be found in the mid to low $180s and mid to lower $160s.
IBM’s February action kicked off with a return to a sell signal and violation of the bullish support line, dropping the stock down to a 3 for 5’er before capping off last week’s action trading back to the middle of the 10-week moving average. This week’s action brought about a reversal into Os and a violation of additional support as shares fell to $260. With this move, the market RS chart against the S&P 500 Equal Weight Index reversed into Os after having been in Xs since October 2025. This brought IBM down to a 2 for 5’er for the first time since late 2023. From here, initial support for the stock now lies at $236, while additional can be found in the mid to upper $220 range.

Although not quite experiencing the same level of technical attribute deterioration, higher attribute names like American Express (AXP), Cisco (CSCO), and Disney (DIS) witnessed breakdowns during this week’s trading.
After rallying to highs in December and early January, American Express (AXP) returned to a sell signal in mid-January. This week’s action brought a third sell signal with the completion of a bearish catapult as shares fell to $340. The stock continues to maintain a 5 technical attribute rating, which has been sustained since January 2024, but this break brings the market RS chart against the S&P 500 Equal Weight Index within one box of reversing into Os. From here, support for the stock now lies at $336, while additional can be found in the $316 to $320 range.
Cisco (CSCO) capped off last week’s action on a positive one with a peer RS buy signal against the NDW Computer Index (DWACOMP), increasing the stock to a 5 technical attribute stock for the first time since 2020. This week’s action started positively with a rally to a new all-time chart high at $88 during Tuesday’s (2/10) trading. Although the company beat on most earnings metrics Thursday (2/12), a conservative outlook and scrutiny over margins brought downside action after reporting earnings. The default point and figure chart returned to a sell signal after breaking a double bottom at $80 as shares fell to $75. From here, initial support now lies at $73, while the bullish support line sits at $71.
Disney’s (DIS) initial sell signal came in October last year following a fifth rally to resistance in the $120s in June that was rejected. Fast-forward to this week’s action and Thursday’s (2/12) reversal into Os led to a third sell signal and drop to the lowest level since November at $102. From here, support lies at current chart levels, while the bullish support line resides at $94.
As for the remainder of the Dow 30 stocks, names like Salesforce (CRM), UnitedHealth (UNH), and Microsoft (MSFT) have seen rebounds off recent lows, while Amgen (AMGN) and Traveler’s Insurance (TRV) have pulled back from recent highs. Notable Mag 7 stocks, Apple (AAPL) and NVIDIA (NVDA) have consolidated this week along with J.P. Morgan (JPM), Goldman Sach (GS), and Boeing (BA). Meanwhile, Visa (V) and Nike (NKE) joined the crowd of stocks falling back to Os after brief reversals into Xs.

