
On Friday, the Bureau of Labor Statistics released the latest Consumer Price Index (CPI), which showed further cooling in inflation. What does this mean for the fixed income space?
On Friday, the Bureau of Labor Statistics (BLS) released the latest Consumer Price Index (CPI), which showed further cooling in inflation. Headline CPI came in 0.1% below expectations, at 2.4% year‑over‑year versus the 2.5% forecast. Notably, tariffs implemented during Liberation Day (April 2025) still remain within the 12‑month lookback window used in the CPI calculation. As those tariffs roll out of the dataset after May, inflation readings should continue to trend lower, removing a key upward influence on price growth.
As inflation cools, expectations for a rate cut continue to rise, reflected immediately after the softer CPI release. The chart below shows the market‑implied probability of a 25-bps rate cut at the June 17th FOMC meeting, which increased from 63% to 67% following Friday’s data. In general, these probabilities are derived by comparing the current federal funds rate to the implied rate embedded in federal funds futures pricing. (Click here to see more).

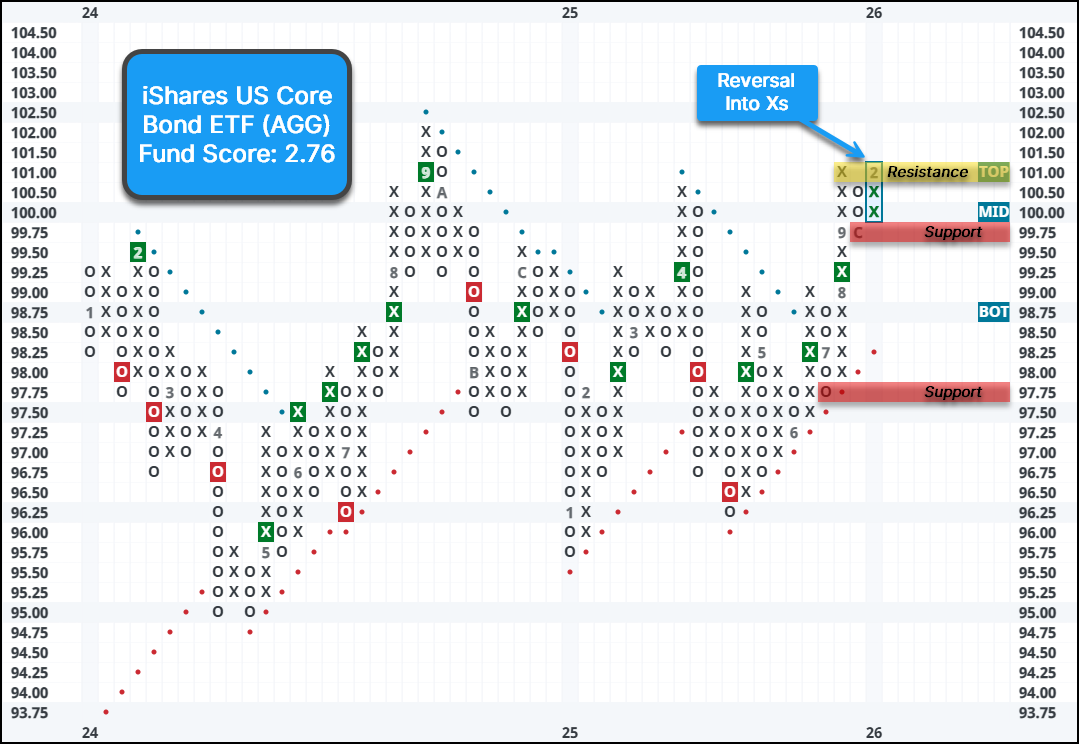
With the latest CPI print, the iShares US Core Bond (AGG), a fixed income ETF that provides exposure to corporate and government-related fixed income bonds, saw some positive movement. The fund reversed back into Xs, after reaching an intraday high above $101, and is now facing resistance at $101. The AGG has a low fund score of 2.76, but does have a positive score direction of 1.22, highlighting improvement in recent months. Support can be seen at $99.75 and $97.75.
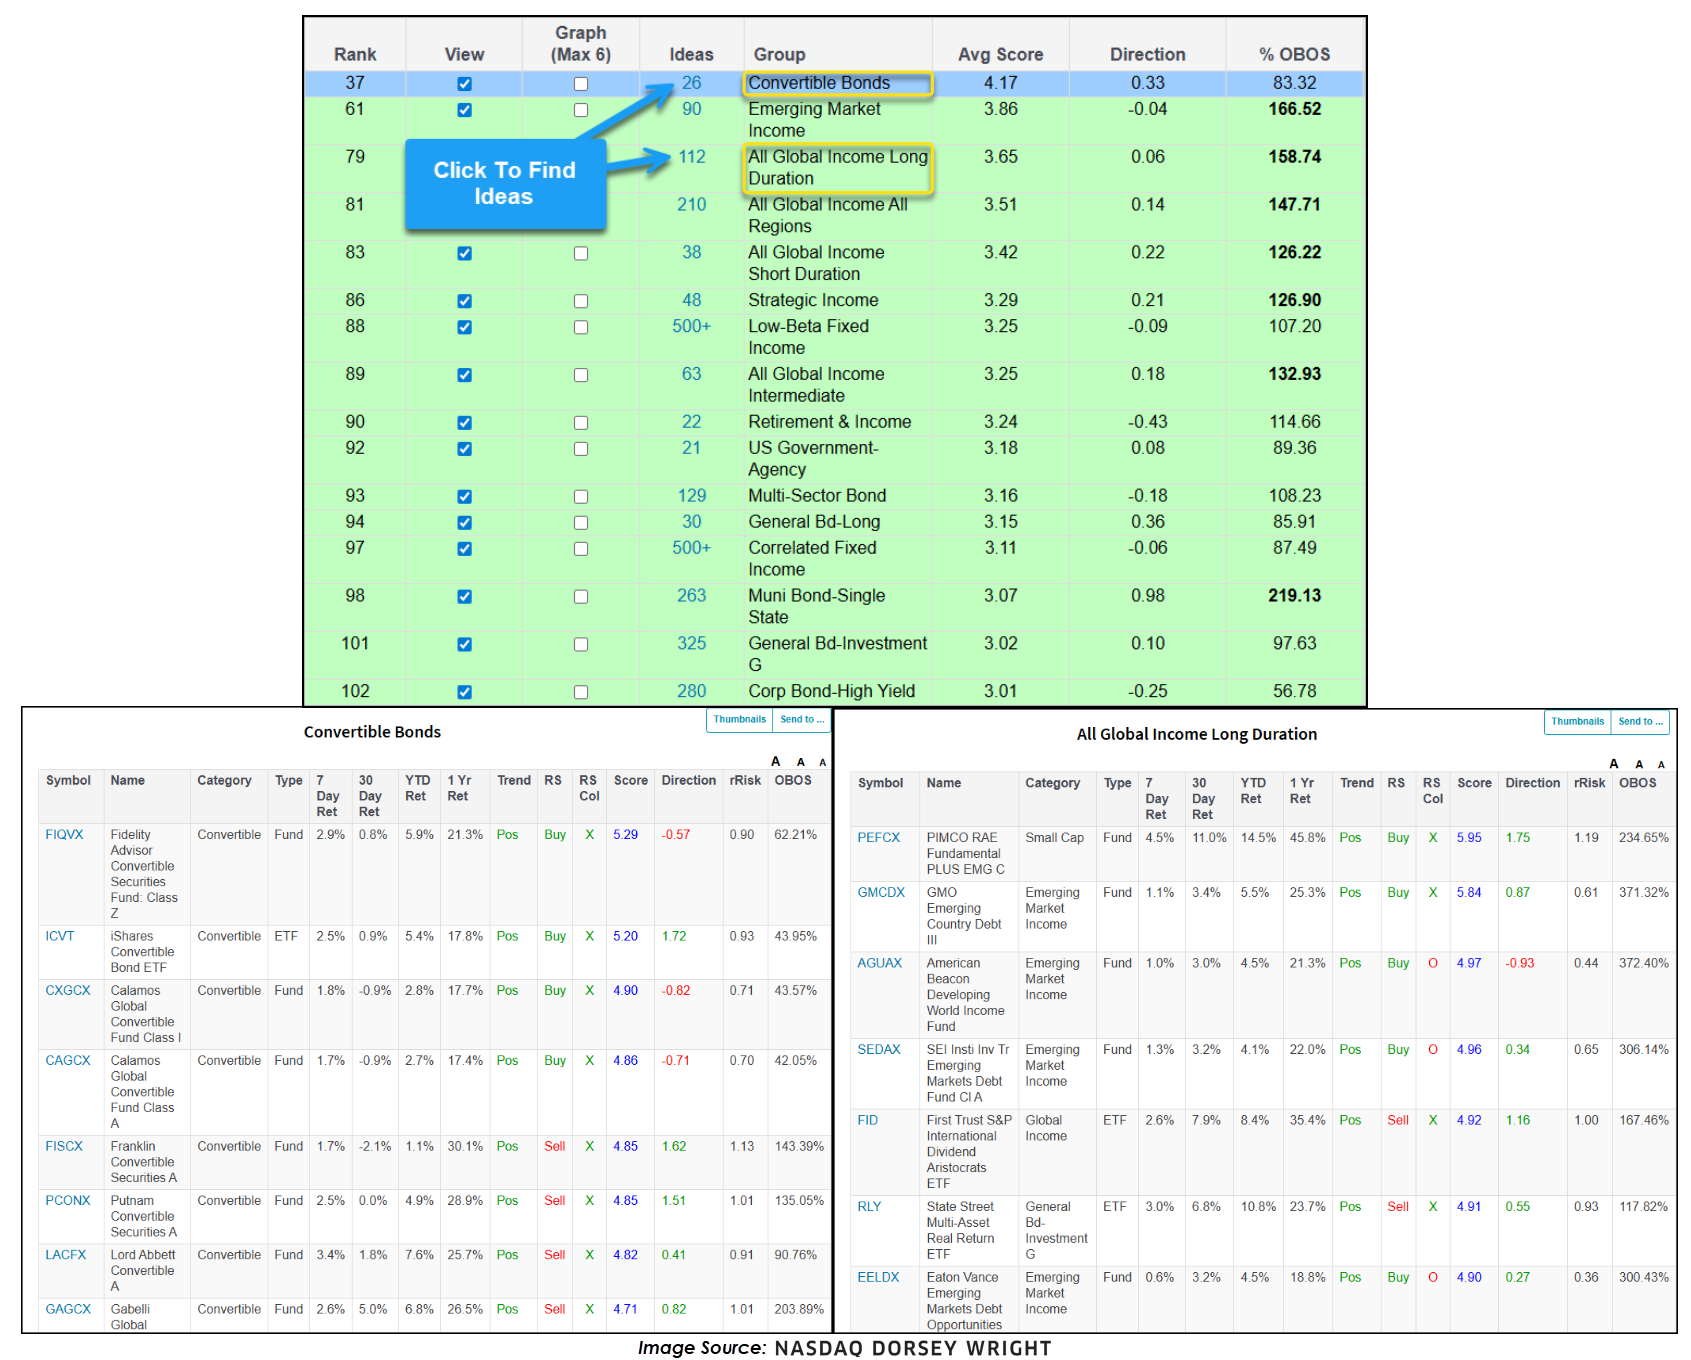
What does this mean for the fixed income space? Although fixed income groups currently rank weaker relative to equities, they remain a core component of client portfolios. The asset class group scores page serves as an effective idea‑generation tool, providing curated list of funds ranked by fund scores, under the “Ideas” tab. As expectations for further rate cuts grow, both equities and fixed income, especially longer‑duration segments, stand to benefit.
One area particularly well‑positioned is the Convertible Bonds group, which currently maintains an attractive average score of 4.17. Because convertibles blend bond and equity characteristics, they may benefit twice: from rising bond prices and from improving equity performance in a rate‑cut environment. Another group likely to see upside is All Global Income Long Duration, which holds a strong average score of 3.65. The group offers exposure to long duration bonds, meaning that these bonds are mathematically more sensitive to falling interest rates.
With inflation continuing to cool and rate‑cut expectations ticking higher, fixed income is entering a more constructive environment. As more opportunities become available, positioning yourself in areas of strength will provide a more favorable risk-reward balance as we move further into 2026.
