Precious metals names struggled quite mightily over the last few days as price action trailed off 2026 highs. We discuss the move and levels you need to watch from a technical perspective.
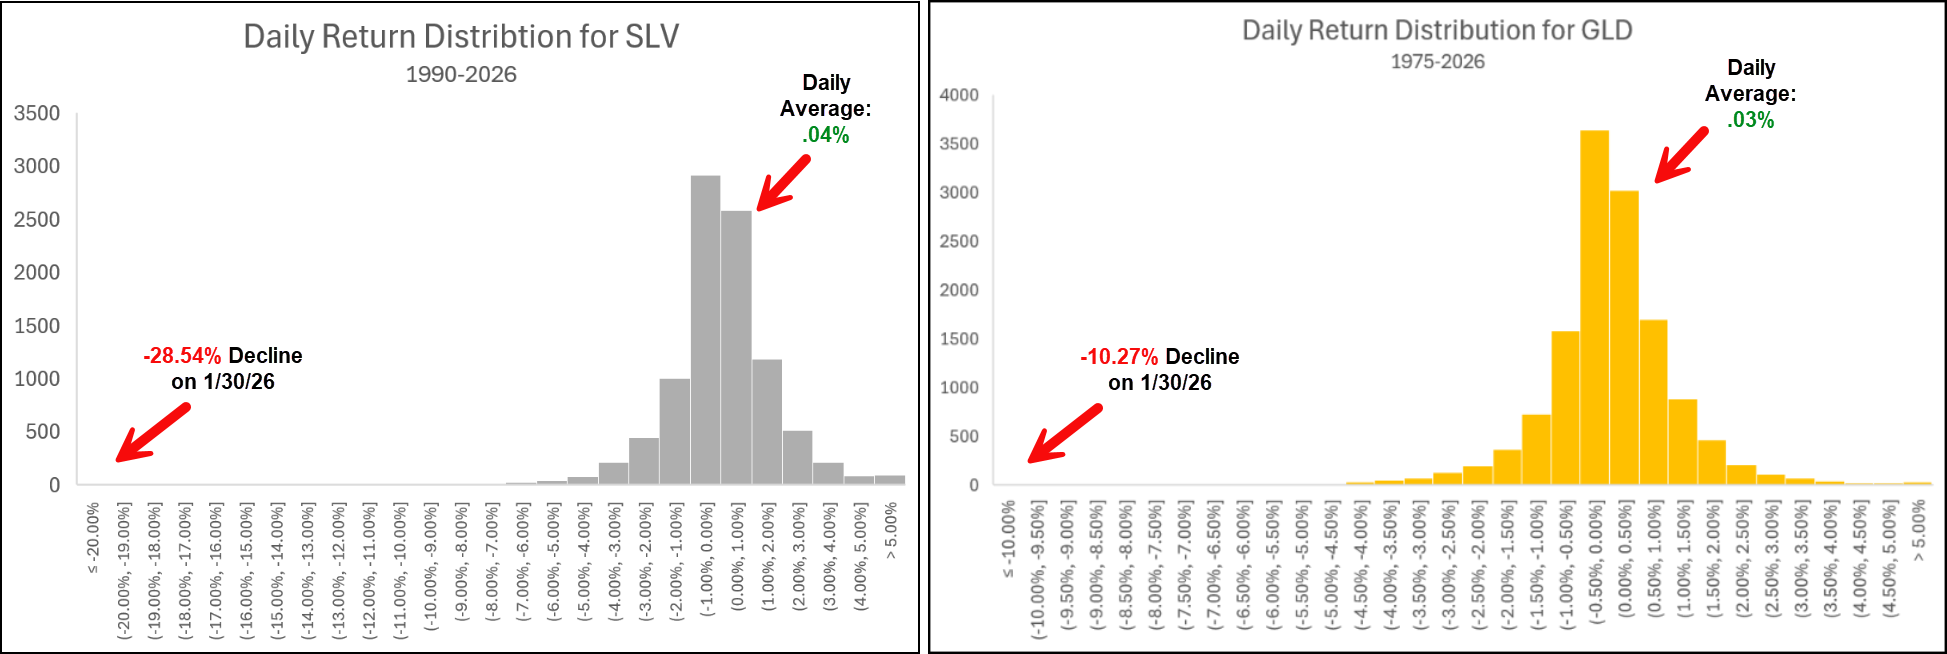
While lots of recent research has hit on precious metals recently, we would be remiss if we didn’t hit on the historically bad end of last week for precious metals. After a meteoric rise over the last few months that saw silver notch action above $110 and gold march above $5,000 p/oz., market action on 1/30 saw both metals crack under the pressure. Gold and silver represented by GLD & SLV feel 10.27% and 28.54% respectively. These “meme-stock” type declines marked the worst trading days in our recorded history for the funds (since 1990 for SLV & 1975 for GLD) and certainly seemed like a short-term cap to the recent market action… at least towards the upside. The charts below help visualize this decline via histogram. An interesting tidbit for the dinner table: the -28.54% return singlehandedly moved the average daily return for silver from +.05% to .04% since 1990. There is certainly some rounding magic going on behind the scenes to help smooth out the values, but the fact that a single day noticeably affected roughly 9,400 trading days lends a hand to how intense the decline was.
Now, the aftermath. Although most of us would have agreed that an exhale/normalization was due for the precious metals space (particularly silver), few of us would have predicted an over 30% intraday decline was coming down the pipeline. With that said, there are undoubtedly those of you who have opened positions at a much higher level than where we currently find ourselves around mid-day on 2/2 (~$70 for SLV). Hopefully, those of you with some portion of your position underwater have some greater proportion of offsetting gains. Despite the losses over the last few trading days, SLV is still up over 10% so far in 2026 and nearly 200% since the start of 2025. This fact brings up our first lesson: remember not to panic. The historic decline certainly hurts, but those following the trends for precious metals over the longer term have been rewarded, especially over the last few years. The now 35-box string of O’s off chart highs for SLV brings the name right back to the middle of the trading band and within just a few dollars of a range of relevant support in the mid-$60’s. All this to say, despite the intense drop, there is some sense of normalcy leaving us with defined ranges of support and resistance we can look towards amid the continued volatility.

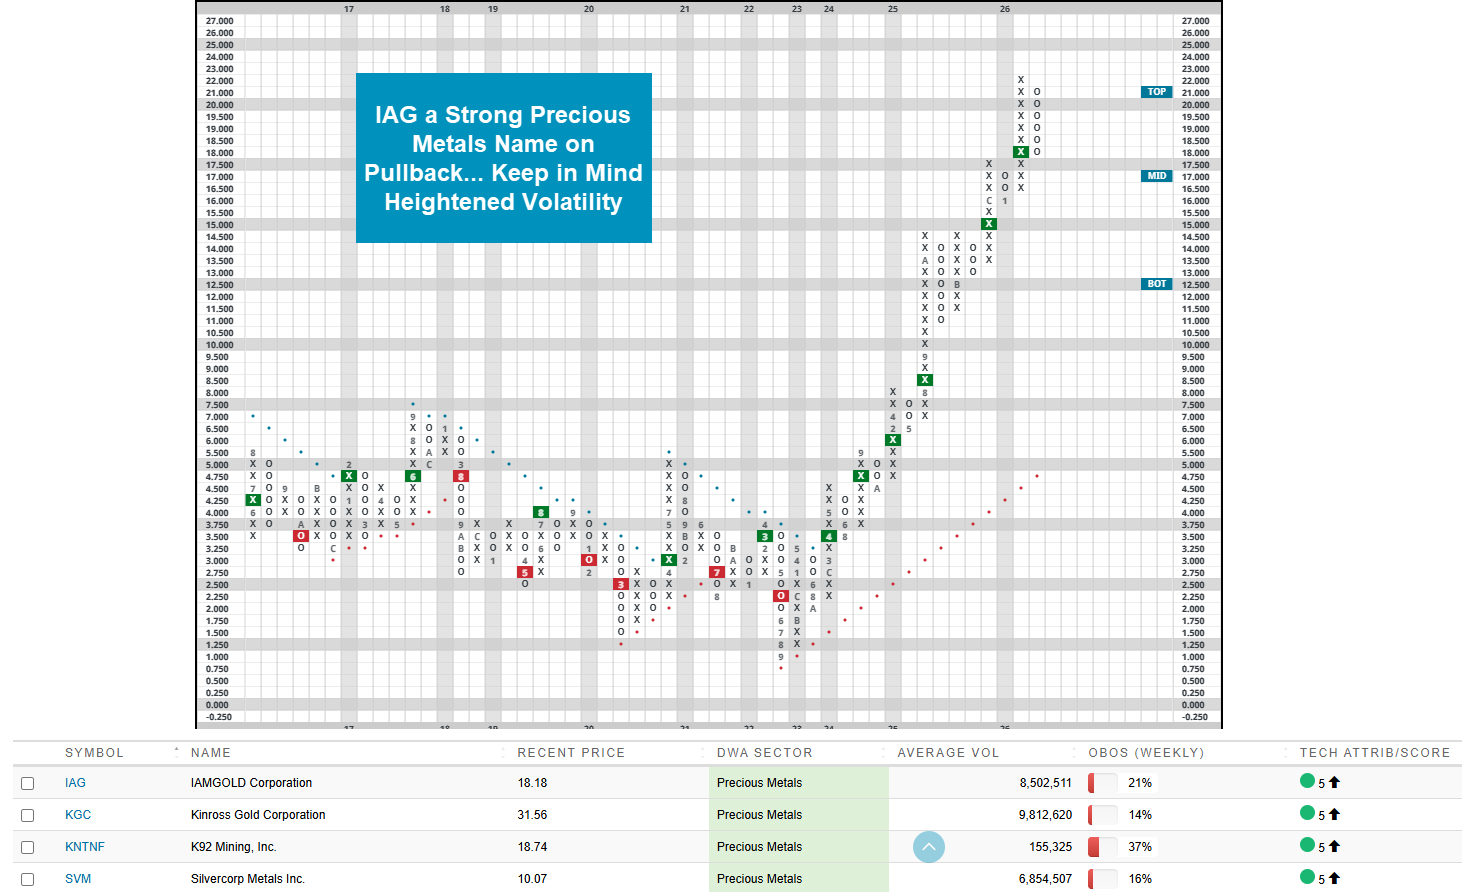
There are four precious metals stocks that maintain their perfect 5/5 TA scores, relevant PnF buy signals on their default charts, and fit some general liquidity overlays. While it probably makes sense to wait until some of the volatility subsides in the space, it is worth having a short-list of options to look into if things start to pick up towards the upside again. The list is below, as well as a highlighted picture for IAMGOLD Corp. (IAG) which recently pulled back off its relative highs. Remember to keep in mind general suitability when considering positions. IAG has an RRisk of 4.25, suggesting that it can move around quite quickly if things continue to head south for precious metals.