Most Requested Symbols

Model Competition Update
As we peer towards the start of Q4, we update our Dow Technical Attribute study, which details recent shifts within the Dow Jones and its constituents' technical postures.
NDW Morning Pulse - September 17, 2026
Below are highlights from the NDW Morning Update Video for the morning of 9/16. Access the video on the NDW Morning Update Video page.

We now have just two weeks left in our model competition, which will end with the close of trading on September 30. While the model returns have changed since we last updated our leaderboard, the teams leading the competition have remained largely the same. At this point, only one model shows a positive cumulative return for the competition period and enjoys a wide lead over the second place competitor.

The return back from the summer brings with it renewed interest from clients as they come back from the beach. The near of the end of Q3 and start of Q4 also brings with it a logical place to “pick the weeds” within your overall market strategy. With that said, we will take today’s feature to update our Dow Technical Attribute Study, giving you ammo to talk about what has changed (and more importantly, what hasn’t) as you await the opening of Q4.
The Dow Jones Industrial Average has gone through many changes over the years, both in the constituents of the index itself and in its relevance as a main market benchmark. In terms of recent changes, both Amazon (AMZN) and NVIDIA (NVDA) were added to the .DJIA within the last few years. Despite these recent more tech focused additions, .DJIA has still struggled to keep up with other major benchmarks. Since 1/1/2023, .DJIA has underperformed SPX & NDX by ~40% and ~107% respectively. Remember, the Dow Jones is a price weighted index, meaning stocks with higher share prices have a greater influence on the index's value. This difference in weighting methodology means that names like GS & CAT have a larger impact on overall movement than the likes of NVDA or AAPL… for better or for worse. The overall technical picture remains quite strong for the Dow Jones as of 9/16, with the name sitting on a string of six consecutive buy signals on its default chart and having pulled back meaningfully towards the middle of its trading band. The absolute picture is one thing, but the relative underperformance mentioned previously is important to avoid, especially if we want those client conversations to go well.
Regardless, there are fundamental analysts that rate all 30 Dow stocks as a "buy," "overweight," or "hold." While this subjective system is one of the limitations to using traditional fundamental research, it does provide advisors with an opportunity to differentiate themselves using a logical, organized, sell discipline based upon something grounded in supply and demand like our Technical Attribute ratings.
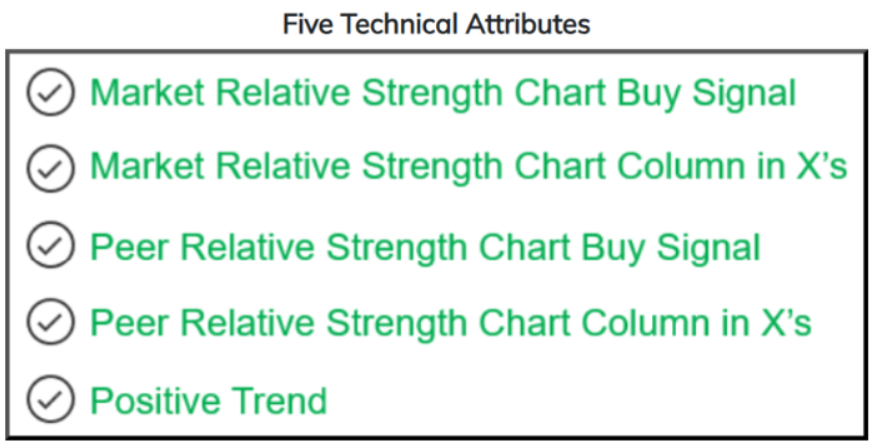
Higher equals better in this rating system. If a stock has all 5 of these attributes in its favor, it is considered a technically strong stock. On the other end of the spectrum, stocks with a technical attribute rating of 0 are considered the weakest of names. As a result, they tend to carry more risk and are often market laggards. This is not to say such stocks can't rise, but our odds of outperformance are much narrower with low attribute names (0, 1, and 2) versus high attribute names (3, 4, and 5). Our general rule of thumb is that a Technical Attribute rating of 3 or higher will increase the odds of success. From an implementation standpoint, using Technical Attributes to evaluate existing portfolios, especially those portfolios being transferred over to you, is one straightforward way to add value.
Reviewing the Stocks in the Dow by Technical Attributes
To put some numbers to this rating system, let's look at a Technical Attribute study using the components of the Dow Jones Industrial Average. We update this periodically in the Daily Equity Report, as it allows us to illustrate the benefit of implementing Technical Attributes into your business using a group of companies familiar to us all. We begin by separating the 30 components of the Dow into two categories: "weak attribute" stocks (0, 1, and 2) and "strong attribute" stocks (3, 4, and 5). The objective is two-fold. First, we want to show how each component has done versus the average stock, as represented by the S&P 500 Equal Weight Index (SPXEWI). Secondly, we hope to show that using the technical attribute system helps capture the important longer-term trends.
The results of the study convey several relevant pieces of information. For instance, not ALL weak attribute stocks underperform, and not ALL high attribute stocks outperform. We would consider this to be a positive, as every time we see a market process that boasts a 100% success rate, we inherently get skeptical. While the TA rating system may not work every time, it does work over time, highlighting stocks that are market leaders and avoiding stocks that are laggards.
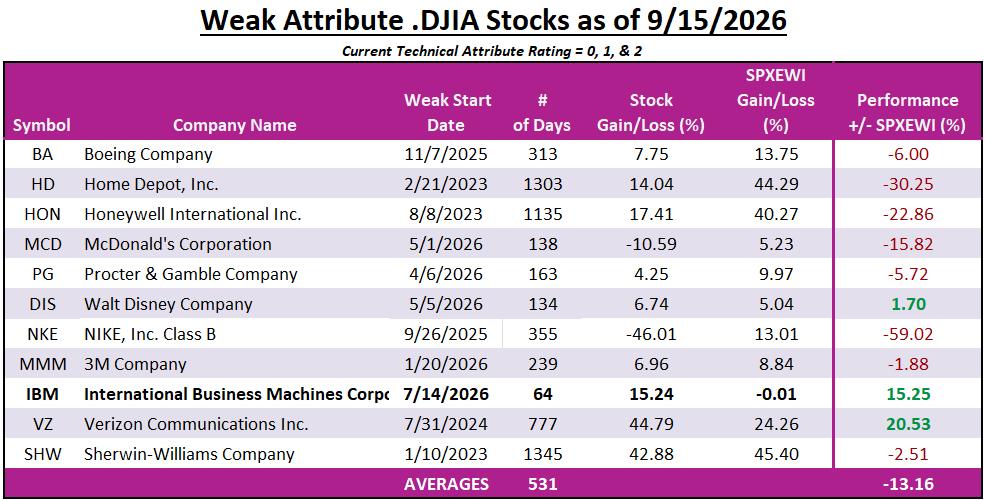
This can be seen in the averages from the tables below. There are currently 19 stocks in the Dow with strong TA ratings (3 or higher) as of 9/15/2026, 3 more than the count from our last update at the beginning of the summer. The average length of time the Technical Attribute Rating has been "strong" for these 19 stocks is 496 days. The average outperformance for those 19 names versus the S&P Equal Weighted Index since becoming strong attribute names is over 45%, excluding dividends. Only three of these names have underperformed SPXEWI during their time in the high attribute territory, NVDA, AMGN, & AMZN. Note that all of these names moved back into “high attribute territory” over the last few months, and their overall underperformance has been relatively narrow. AMZN has been the worst relative performer, lagging behind SPXEWI by just over 10%. The average outperformance for those names that have been high attributes for over a year (AAPL, AXP, CAT, GS, TRV, JPM, & WMT) is over 106%, highlighting the importance of holding onto established winners over time. More recent movers (since our last update in June) are highlighted in each table below, helping draw attention to those stocks that have gained/lost favor.
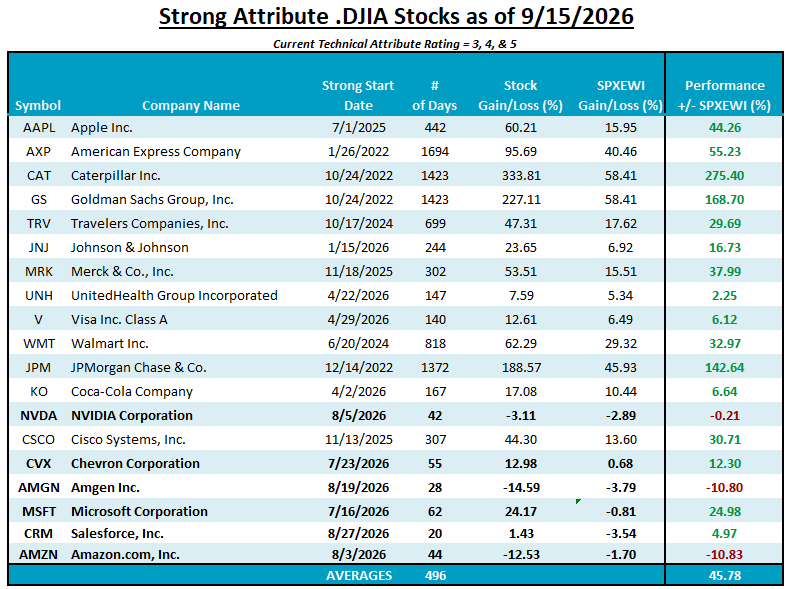
On the other hand, the remaining 11 stocks in the Dow are categorized as weak attribute names (2 or lower), and on average, these stocks have been technically weak for 531 days. Once a stock falls below the threshold of 3 positive attributes, this condition of lethargy can persist for an extended period. The average underperformance of these stocks since becoming weak attribute names is -13.10%, illustrating the importance of watching the Technical Attribute pictures for stocks that you own or manage over time. When observing just those names that have been low attributes for over 1 year (HD, HON, SHW) that underperformance grows to over 18.50%. Just like our positive attribute table, there are certainly instances where low attribute stocks can outperform the benchmark. If this outperformance persists, these stocks can (and have) become high RS names fit for investment.
This screening process can be both a crucial aspect of your portfolio management strategy and an important part of your story with clients and prospects. The "story," in this case, is not "being right all the time." Instead, it is adding a level of analysis to your process that is not afraid to say "sell" when a holding indicates that it has likely gone into hibernation… while more fundamental analysts will maintain their “buy” or “hold” rating far longer than it would be rational. While these ratings may miss a few modest periods of outperformance or underperformance, it is self-correcting by nature, helping you to stick with the important trends in the market.

Each week the analysts at NDW review and comment on all major asset classes in the global markets. Shown below is the summary or snapshot of the primary technical indicators we follow for multiple areas. Should there be changes mid-week we will certainly bring these to your attention via the report.
| Universe | BP Col & Level (actual) | BP Rev Level | PT Col & Level (actual) | PT Rev Level | HiLo Col & Level (actual) | HiLo Rev Level | 10 Week Col & Level (actual) | 10 Week Rev Level | 30 Week Col & Level (actual) | 30 Week Rev Level |
|---|---|---|---|---|---|---|---|---|---|---|
| ALL |
|
44% |
|
38% |
|
32% |
|
42% |
|
50% |
| NYSE |
|
50% |
|
56% |
|
32% |
|
42% |
|
54% |
| OTC |
|
36% |
|
32% |
|
32% |
|
44% |
|
48% |
| World |
|
44% |
|
46% |
|
|
|
48% |
|
40% |
Remember, these are technical comments only. Just as you must be aware of fundamental data for the stocks we recommend based on technical criteria in the report, so too must you be aware of important data regarding delivery, market moving government releases, and other factors that may influence commodity pricing. We try to limit our technical comments to the most actively traded contracts in advance of delivery, but some contracts trade actively right up to delivery while others taper off well in advance. Be sure you check your dates before trading these contracts. For questions regarding this section or additional coverage of commodities email james.west@nasdaq.com.
Data represented in the table below is through 9/15/26:
| Symbol | Name | Price | PnF Trend | RS Signal | RS Col. | 200 Day MA | Weekly Mom |
|---|---|---|---|---|---|---|---|
| CL/ | Crude Oil Continuous | 105.83 | Positive | Sell | X | 79.90 | + 9W |
| DWACOMMOD | NDW Continuous Commodity Index | 1266.01 | Positive | Buy | X | 1154.44 | + 11W |
| GC/ | Gold Continuous | 4291.60 | Positive | Buy | O | 4529.66 | - 1W |
| HG/ | Copper Continuous | 6.37 | Negative | Sell | X | 6.03 | - 2W |
| ZG/ | Corn (Electronic Day Session) Continuous | 535.75 | Positive | Sell | X | 449.84 | + 11W |


Average Level
-20.08
| < - -100 | -100 - -80 | -80 - -60 | -60 - -40 | -40 - -20 | -20 - 0 | 0 - 20 | 20 - 40 | 40 - 60 | 60 - 80 | 80 - 100 | 100 - > |
|---|---|---|---|---|---|---|---|---|---|---|---|
|
Buy signaldx/y
|
|||||||||||
|
Buy signalefa
|
|||||||||||
|
Sell signalQQQ
|
|||||||||||
|
Sell signallqd
|
Buy signalVOOG
|
||||||||||
|
Buy signalicf
|
Buy signalSPY
|
||||||||||
|
Sell signalshy
|
Buy signalijr
|
Buy signalrsp
|
Buy signalVOOV
|
Buy signalgld
|
Buy signalUSO
|
||||||
|
Sell signalhyg
|
Sell signaltlt
|
Buy signaldia
|
Sell signalEEM
|
Sell signalfxe
|
Buy signalgcc
|
||||||
|
Sell signalief
|
Sell signalagg
|
Buy signalIJH
|
Buy signaliwm
|
Buy signaldvy
|
Sell signalONEQ
|
Buy signalxlg
|
Buy signalGSG
|
||||
| < - -100 | -100 - -80 | -80 - -60 | -60 - -40 | -40 - -20 | -20 - 0 | 0 - 20 | 20 - 40 | 40 - 60 | 60 - 80 | 80 - 100 | 100 - > |
| AGG | iShares US Core Bond ETF |
| USO | United States Oil Fund |
| DIA | SPDR Dow Jones Industrial Average ETF |
| DVY | iShares Dow Jones Select Dividend Index ETF |
| DX/Y | NYCE U.S.Dollar Index Spot |
| EFA | iShares MSCI EAFE ETF |
| FXE | Invesco CurrencyShares Euro Trust |
| GLD | SPDR Gold Trust |
| GSG | iShares S&P GSCI Commodity-Indexed Trust |
| HYG | iShares iBoxx $ High Yield Corporate Bond ETF |
| ICF | iShares Cohen & Steers Realty ETF |
| IEF | iShares Barclays 7-10 Yr. Tres. Bond ETF |
| LQD | iShares iBoxx $ Investment Grade Corp. Bond ETF |
| IJH | iShares S&P 400 MidCap Index Fund |
| ONEQ | Fidelity Nasdaq Composite Index Track |
| QQQ | Invesco QQQ Trust |
| RSP | Invesco S&P 500 Equal Weight ETF |
| IWM | iShares Russell 2000 Index ETF |
| SHY | iShares Barclays 1-3 Year Tres. Bond ETF |
| IJR | iShares S&P 600 SmallCap Index Fund |
| SPY | SPDR S&P 500 Index ETF Trust |
| TLT | iShares Barclays 20+ Year Treasury Bond ETF |
| GCC | WisdomTree Continuous Commodity Index Fund |
| VOOG | Vanguard S&P 500 Growth ETF |
| VOOV | Vanguard S&P 500 Value ETF |
| EEM | iShares MSCI Emerging Markets ETF |
| XLG | Invesco S&P 500 Top 50 ETF |
| Symbol | Company | Sector | Current Price | Action Price | Target | Stop | Notes |
|---|---|---|---|---|---|---|---|
| FR | First Industrial Realty Trust | Real Estate | $61.37 | mid-to-hi 60s | 86 | 59 | 4 for 5'er, top 25% of REAL sector matrix, LT pos peer RS, spread sextuple top, R-R>2.0, 2.9% yield |
| HIG | Hartford Insurance Group Inc/The | Insurance | $136.03 | hi 130s - 140s | 164 | 126 | 5 for 5'er, LT pos peer & mkt RS, bullish catapult, good R-R, 1.65% yield |
| GHRS | GH Research Plc | Biomedics/Genetics | $27.57 | 28 - 33 | 46.50 | 24 | 5 for 5'er, LT Mkt. since Feb. '25, top quintile of Bio. matrix, matched chart high on 8/7. |
| CAH | Cardinal Health, Inc. | Drugs | $232.65 | 224 - mid 240s | 334 | 188 | 4/5 TA rating, top 50% of DRUG sector matrix, LT RS buy, consec buy signals, buy-on-pullback |
| AME | Ametek Inc | Electronics | $234.45 | mid 230s - mid 250s | 342 | 204 | 4 for 5'er, LT pos mkt RS, bullish catapult, buy on pullback, R-R>2.0 |
| WELL | Welltower Inc. | Real Estate | $232.76 | low 230s to low 250s | 366 | 194 | 5 for 5'er since Feb. '24, top quintile of Real Est. matrix, Pos. trend since Feb. '24, buy on pullback. |
| CENTA | Central Garden & Pet Company | Household Goods | $34.61 | mid-to-hi 30s | 48 | 31 | 4 for 5'er, favored HOUS sector, LT pos peer RS, spread quad top, buy on pullback |
| HUM | Humana Inc. | Healthcare | $396.62 | hi 380s - mid 410 | 468 | 352 | 5 for 5'er, top half of Healthcare sector matrix, Pos. trend since Apr. '26, LT Mkt. and Peer RS. |
| CLH | Clean Harbors Inc | Waste Management | $318.20 | 310s - 320s | 356 | 288 | 5 for 5'er, #3 of 22 in WAST sector matrix, LT pos peer & mkt RS |
| AU | AngloGold Ashanti Limited (South Africa) ADR | Precious Metals | $100.71 | 100s - low 110s | 144 | 92 | 4 for 5'er, top 20% of favored PREC sector matrix, LT pos peer RS, one box from mkt RS, R-R~2.0, 4.1% yield |
| JXN | Jackson Financial Incorporation Class A | Insurance | $138.21 | low 130 - 140 | 176 | 114 | 5 for 5'er, top quartile of Insurance matrix, Pos. trend and buy signal since July '26, ATH on 9/3. |
| ASC | Ardmore Shipping Corporation | Transports/Non Air | $18.74 | 17 - 19 | 24 | 15.50 | 5 for 5'er, top 20% of favored TRAN sector matrix, triple top, good R-R, 7.5% yield |
| CIB | Bancolombia S.A. (Colombia) ADR | Banks | $100.67 | hi 90s - low 100s | 125 | 87 | 5 for 5'er, #3 of 188 in favored BANK sector matrix, LT pos peer RS, triple top, 3.9% yield |
| OSCR | Oscar Health, Inc. Class A | Insurance | $32.44 | 31 - 36 | 48 | 25 | 5 for 5'er, top quintile of Biotech matrix, Pos. S-T Mkt. RS on 9/8, Multi-year high on 9/11. |
| ASX | ASE Industrial Holding Co., Ltd. Sponsored ADR | Semiconductors | $37.12 | hi 30s | 52 | 31 | 5 for 5'er, top 10% of SEMI sector matrix, LT pos peer & mkt RS, triple top, R-R~2.0 |
| Symbol | Company | Sector | Current Price | Action Price | Target | Stop | Notes |
|---|
| Comment | |||||||
|---|---|---|---|---|---|---|---|
|
|
|||||||
ASX ASE Industrial Holding Co., Ltd. Sponsored ADR R ($38.04) - Semiconductors - ASX is a 5 for 5'er that ranks in the top decile of the semiconductors sector matrix and has been on peer and market RS buy signals since 2023 and 2024, respectively. After giving three consecutive sell signals, ASX found support in the lower $30s and rallied, returning to a buy signal with a triple top break at $41. The stock has subsequently pulled back to below the middle of its trading band, just above prior support, offering an entry point for long exposure. Positions may be added in the upper $30s and we will set our initial stop at $31, which would take out two levels of support on ASX's default chart. We will use the bullish price objective, $52, as our target price, giving us a reward-to-risk ratio of roughly 2.0. ASX also carries a 1.1% yield.
| 26 | |||||||||||||||||||||||||||||
| 45.00 | X | X | 45.00 | ||||||||||||||||||||||||||
| 44.00 | X | X | O | X | O | X | 44.00 | ||||||||||||||||||||||
| 43.00 | X | O | X | O | X | O | X | O | 43.00 | ||||||||||||||||||||
| 42.00 | X | O | X | 7 | O | X | O | 42.00 | |||||||||||||||||||||
| 41.00 | X | X | O | X | O | X | O | X | 41.00 | ||||||||||||||||||||
| 40.00 | X | O | X | X | O | X | O | X | O | X | X | 9 | O | 40.00 | |||||||||||||||
| 39.00 | X | O | X | O | X | O | O | O | X | O | X | O | X | O | 39.00 | ||||||||||||||
| 38.00 | X | 6 | X | O | X | O | X | O | 8 | O | X | O | Mid | 38.00 | |||||||||||||||
| 37.00 | X | O | O | X | O | O | X | O | X | O | 37.00 | ||||||||||||||||||
| 36.00 | X | O | X | O | X | O | 36.00 | ||||||||||||||||||||||
| 35.00 | X | X | O | X | O | X | 35.00 | ||||||||||||||||||||||
| 34.00 | X | O | X | O | X | O | X | 34.00 | |||||||||||||||||||||
| 33.00 | 5 | O | X | O | O | X | 33.00 | ||||||||||||||||||||||
| 32.00 | X | O | X | O | 32.00 | ||||||||||||||||||||||||
| 31.00 | X | O | X | 31.00 | |||||||||||||||||||||||||
| 30.00 | X | O | 30.00 | ||||||||||||||||||||||||||
| 29.00 | X | 29.00 | |||||||||||||||||||||||||||
| 28.00 | X | Bot | 28.00 | ||||||||||||||||||||||||||
| 27.00 | X | 27.00 | |||||||||||||||||||||||||||
| 26.00 | X | 26.00 | |||||||||||||||||||||||||||
| 25.00 | X | X | 25.00 | ||||||||||||||||||||||||||
| 24.00 | X | O | 4 | 24.00 | |||||||||||||||||||||||||
| 23.00 | X | O | X | 23.00 | |||||||||||||||||||||||||
| 22.00 | X | 3 | X | 22.00 | |||||||||||||||||||||||||
| 21.00 | X | O | • | 21.00 | |||||||||||||||||||||||||
| 20.00 | X | X | • | 20.00 | |||||||||||||||||||||||||
| 19.50 | X | O | X | • | 19.50 | ||||||||||||||||||||||||
| 19.00 | X | O | X | • | 19.00 | ||||||||||||||||||||||||
| 18.50 | X | 2 | • | 18.50 | |||||||||||||||||||||||||
| 18.00 | X | • | 18.00 | ||||||||||||||||||||||||||
| 17.50 | X | • | 17.50 | ||||||||||||||||||||||||||
| 17.00 | X | • | 17.00 | ||||||||||||||||||||||||||
| 16.50 | X | 1 | • | 16.50 | |||||||||||||||||||||||||
| 16.00 | X | O | X | • | 16.00 | ||||||||||||||||||||||||
| 15.50 | X | O | X | • | 15.50 | ||||||||||||||||||||||||
| 15.00 | C | O | • | 15.00 | |||||||||||||||||||||||||
| 14.50 | X | • | 14.50 | ||||||||||||||||||||||||||
| 14.00 | X | • | 14.00 | ||||||||||||||||||||||||||
| 26 |
| COST Costco Wholesale Corporation ($900.34) - Retailing - COST broke a double bottom at $896 for a third sell signal since peaking in May at $1088. This brings the trend chart down to test the bullish support line, which would be violated with a move below $864. Additionally, the market and peer RS charts reside within one box of giving an RS sell signal for the first time since 2007 and 2015, respectively. From here, support beyond the bullish support line lies at $848, the December 2025 chart low. |
| ON On Semiconductor Corp. ($66.51) - Semiconductors - Shares of ON broke a double bottom at $68 as it continues to push lower. The low attribute name has weakened significantly, moving into a negative trend in July. Those with exposure should eventually cut it loose, but should wait for a rebound or consolidation given its oversold positioning nearing the bottom of the ten week trading band. |
| SYY Sysco Corporation ($78.41) - Food Beverages/Soap - SYY inched lower to complete a double bottom break at $79, marking its second consecutive sell signal. The 2 for 5'er moved down from a 3 last month after moving back to a negative trend. A sell can be considered here, given the weight of the evidence. Strong resistance can be seen at various levels between $84-$86. |
| TMO Thermo Fisher Scientific Inc. ($650.26) - Healthcare - TMO inched higher to complete a double top break at $648, marking its fifth consecutive buy signal and a multi-year intraday high. The 3 for 5'er is still rated a hold, but has shown much improvement from lows back in May. Additionally, the stock ranks in the top third of the healthcare sector matrix. Continue to wait for further improvement, as the stock is still rated a hold and sits in overbought territory. Initial support is at $600, with additional support at $560. |
The option suggestions featured here are pulled from the NDW Options Ideas tool. These are just a sample of the ideas that can be found there. The Options Idea tool contains numerous additional income and speculative plays. It also offers relative strength-based screens targeting the highest (and lowest) relative strength stocks and ETFs that have recently moved counter to their longer-term trend. To access or subscribe to the Options Ideas tool, click here.
Call
J.P. Morgan Chase & Co. (JPM) Dec 18 $345 Call

| Additional Data: | |
| Bid/Ask Spread | 4.44% |
| Delta | 57.74 |
| Gamma | 0.93 |
| Implied Volatility | 24.79% |
| Expiry Date | 93 |
| Earnings Date | 10/13/2026 |
Put
AppLovin Corp. Class A (APP) Dec 18 $330 Put

| Additional Data: | |
| Bid/Ask Spread | 21.41% |
| Delta | -44.78 |
| Gamma | 0.40 |
| Implied Volatility | 64.56% |
| Expiry Date | 93 |
| Earnings Date | 11/04/2026 |
Income
Visa Inc. (V) Oct 16 $175 Short Put

| Additional Data: | |
| Ann. Static Return | 11.35% |
| Bid/Ask Spread | 10.00% |
| Delta | 24.04 |
| Gamma | -0.97 |
| Implied Volatility | 23.74% |
| Expiry Date | 44 |
| Earnings Date | 10/27/2026 |
Daily Equity & Market Analysis
Loading, Please Wait...

