We review recent Bullish Percent (BP) and Positive Trend (PT) indicator updates.
Applying the Fund Score Method through FSM Models: Join us on Thursday, May 21st at 1pm ET for a live webinar on the application of fund scores in a systematic, rules-based model. This webinar will feature an overview of the various FSM strategies and potential implementation ideas. Click here to register!
Replay for Fund Scores and Asset Class Group Scores Webinar: We have a replay available for our latest webinar on Fund Scores and the Asset Class Group Scores page that took place on Thursday, May 14th. In this webinar, we explore the concepts and methodology used to calculate the Fund Score that is assigned to ETFs and Mutual Funds across the NDW Research Platform. Click here to view the replay!
Replay of Monday's Market Update Webinar - We now have the replay available from our Monday, May 18th market update webinar. Links to the video and presentation slides are provided below.
Click here to access the replay
Click here to access the slides
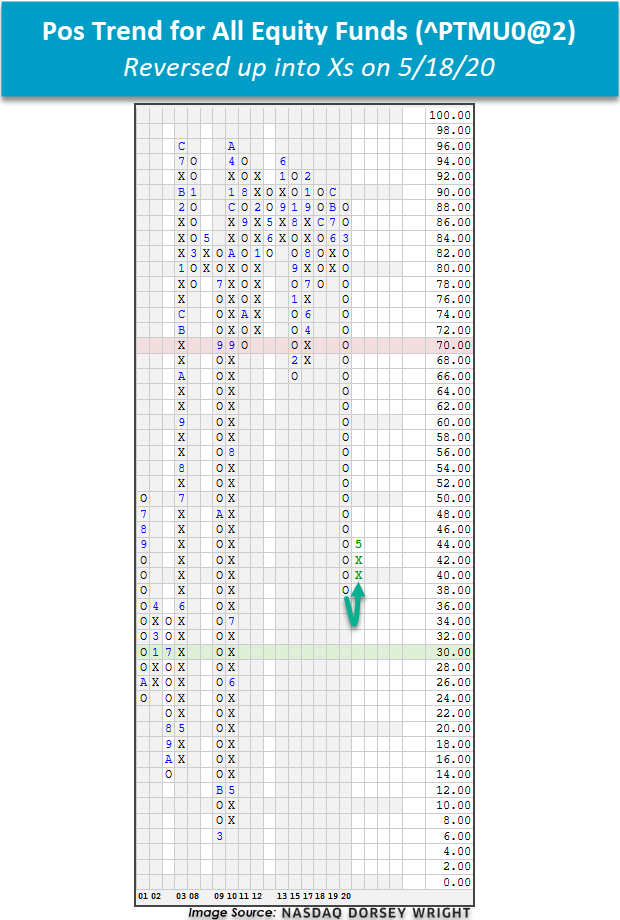
Indicator Updates: With yesterday’s market action, Bullish Percent (BP) indicators for the NYSE ^BPNYSE and S&P 500 ^BPSPX both reversed back up into Xs and are now in midfield. As a refresher, BP indicators are participation readings that assess the percentage of stocks within a universe that are trading on Point & Figure buy signals and reversals up indicate that offense is back on the field for the respective universes. Yesterday also saw the reversal up for the Positive Trend for All Equity Funds ^PTMU0@2, which, as the name implies, measures the percentage of mutual funds and ETFs trading in a positive trend on their intermediate-term fund scale charts. This indicator had fallen to a multi-year low of 38% and until yesterday, had yet to reverse back up into Xs since before the recent market selloff; the indicator suggests that we’re beginning to see continued bullish follow-through from equity funds around the world. Furthermore, today’s intraday action should result not only in the continued ascent of the column level on BPSPX but also trigger a reversal up into Xs on the Bullish Percent for Nasdaq 100 Stocks BPNDX. You can monitor BP, PT, and other major indicator charts from the Technical Indicator Report found under the Asset Allocation tab at the top of the platform.

