Most Requested Symbols

After advancing to second place in our DALI asset class rankings earlier this month (3/6), commodities have continued to gain relative strength, surpassing international equities to claim the top spot as of 3/12.
There is also a market adage about “Beware the Ides of March” from the Stock Trader’s Almanac, as the middle of the month can bring added volatility leading into the back half of the month. The recent bias over the past roughly 20 years or so has brought lows during the middle of the month for the market to rally in the latter part of March.
Weekly Rundown Video – Mar 12, 2026
Weekly rundown with NDW analyst team covering all major asset classes.
Weekly rundown with NDW analyst team covering all major asset classes.
After advancing to second place in our DALI asset class rankings earlier this month (3/6), commodities have continued to gain relative strength, surpassing international equities to claim the top spot as of 3/12. The improvement across the asset class has been driven by several notable tailwinds, including rising energy demand tied to AI infrastructure build‑outs, heightened geopolitical volatility, and ongoing supply constraints.
The chart below highlights both the historical DALI signal for commodities and their positioning within the broader DALI asset class rankings. As shown in the signal history, commodity signals can shift meaningfully—and at times rapidly—resulting in notable changes in relative rankings. These sharp inflections often prompt an important question for investors: What does the investment environment for commodities look like following a move higher in DALI rankings?

To address this question, we examined historical instances where:
After identifying these occurrences and removing one‑month clustering effects, we analyzed the forward returns of the iShares G&P GSCI Commodity‑Indexed Trust (GSG) across multiple time horizons to better understand the investment backdrop following these ranking shifts.
Since 2002, commodities have moved from third to second place 20 times, and from second to first place 11 times. When focusing on the instances where commodities advanced to second place, forward returns 180 days later averaged 6.48%, suggesting that the asset class has historically continued to exhibit upside momentum following these transitions. At the one‑year mark, average returns were 6.17%, exceeding the long‑term average performance of most commodity index (~5% depending on sample period).
Looking specifically at the 11 instances in which commodities moved into the top position in DALI, forward returns over shorter time horizons were also constructive. Average returns at the 90‑day and 180‑day intervals measured 2.58% and 6.11%, respectively. However, one‑year forward returns were historically flat, underscoring the inherently cyclical and fast‑moving nature of commodity markets. Importantly, these forward‑return figures do not account for changes in DALI rankings during the forward period. In practice, periods of flattening or deteriorating performance would likely be captured by DALI’s signal framework, prompting a rotation toward asset classes exhibiting stronger relative strength.

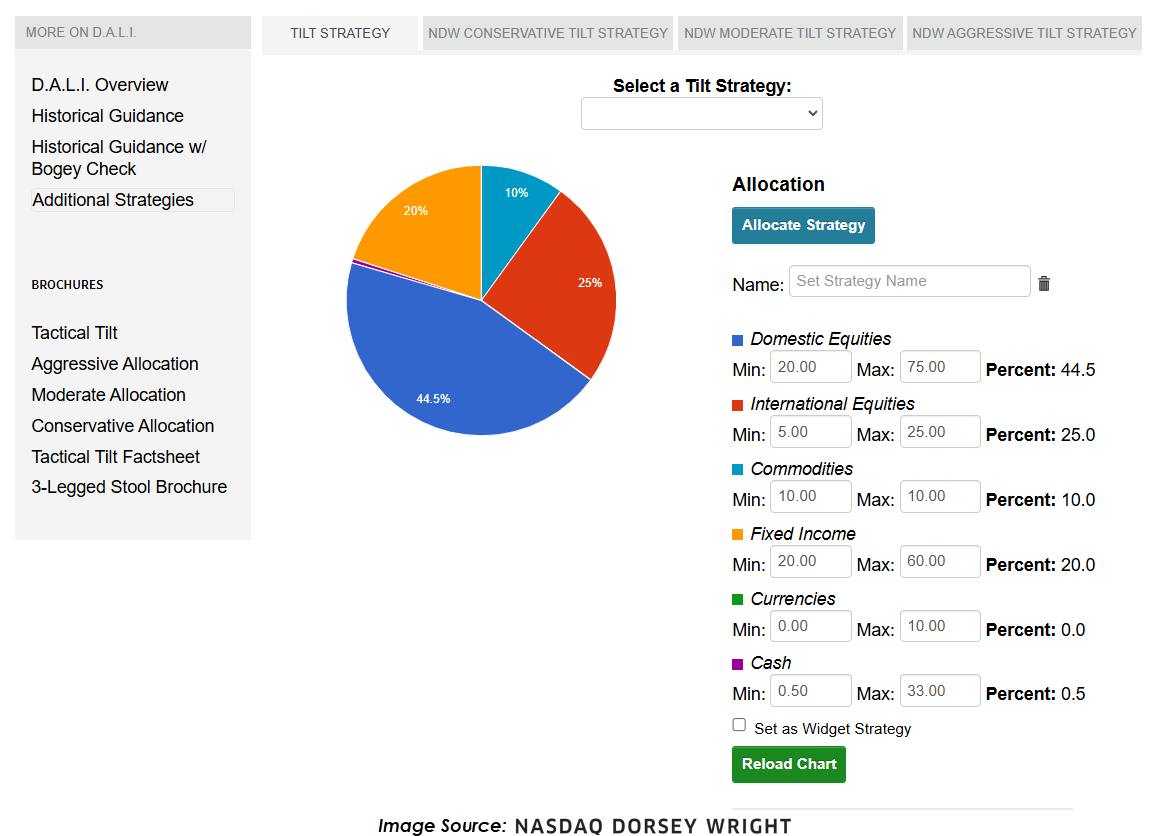
For investors, this reinforces the importance of pairing DALI insights with a disciplined allocation framework. The DALI Tilt Strategy is particularly effective in this regard, allowing users to set minimum and maximum allocation bands by asset class while systematically increasing exposure to areas of relative strength. By maintaining diversification while tactically adjusting positioning, investors can better navigate the inherently volatile nature of commodity markets and remain aligned with evolving market leadership.
In short, commodities’ recent move to the top of DALI rankings highlights opportunity—but it is the process-driven application of DALI, rather than any single signal, that ultimately supports long‑term investment success.

“Beware the Ides of March!” Some may be familiar with the phrase as a warning to Julius Ceasar to beware the Ides of March as potential harm may come to him before his very assassination in the middle of March (the Roman calendar referred to the middle of each month as the Ides). There are numerous other mythological and theological references to the Ides of March as a time for celebrations and festivals, but also as a time when there is typically a full moon, which can be perceived by some who follow astrology as a period in a month when things can get a bit wacky. Barring the aforementioned references, there is also a market adage about “Beware the Ides of March” from the Stock Trader’s Almanac, as the middle of the month can bring added volatility leading into the back half of the month.
The first table below highlights the average performance of the S&P 500 Index (SPX) during the first and second half of March since 1957, along with the full months and the year-to-date performance. Through the first roughly 50 years of study, the front half of the month outperformed the back half on average. But as a recent note from Jeff Hirsch (the editor of the Stock Trader’s Almanac) noted, the recent bias over the past roughly 20 years or so has brought lows during the middle of the month for the market to rally in the latter part of March.

The second table expands on this study and shows the performance of SPX week by week through the month of March. On average, the second and fourth weeks of the month tend to produce the best performance, while the first week tends to be muted and the third week brings about downside action. Below highlights some of the performance tendency observed from the week-by-week performance data.

Going back to the beginning of 1957, there have been 22 instances of the first two weeks of March yielding positive performance when examining week by week data. On average, when the first two weeks have been positive, the back half of the month has been down roughly 60% of the time and down 58 basis points on average.
Examining the data when only one of the first two weeks is positive reveals that the performance has been better in the back half of the month, on average when the index is negative the first week and positive the second. When the first week of March has been positive and the second week negative, returns in the back half of the month are down 5 basis points on average. Meanwhile, when the first week of March is negative and the second week positive, returns in the back half of the month are up 1.17% on average.
What is intriguing about March 2026 is that Friday’s (3/13) close marks a third year in a row that action during the first two weeks of March was negative when examining week-by-week performance. The first full week of the month this year witnessed SPX fall more than 2% (2/27 – 3/6), while this week’s action saw the index shed another 1.6%. Looking back to March 1957, SPX has been negative during the first two weeks when examining week by week returns on 13 prior instances, with over 60% of those occurring since 2001. During prior occurrences, SPX has generally seen a rebound during the two weeks following when examining week-by-week performance and a two-week roll. Three years – 1980, 2005, and 2025 – were the only years resulting in additional downside to close out the month of March. 76% of the 13 instances have resulted in positive returns in the final two-week stretch of March with SPX registering an average return of 1.11%.
With the third week of the month upcoming, investors will see if U.S. equity indices can find some footing for the back half of the month. Years like 1970, 2001, and 2004 witnessed negative action during the third week, continuing downside from the prior weeks, before those three years saw a notable rebound during the fourth week to finish the month out positively. As we are near the end of the first quarter of 2026, March’s performance has brought many indices into negative territory on a year-to-date basis, and the final two weeks could very well determine if the quarter is negative or positive. Additionally, with domestic equities falling to the third position and the recent shake up to the top of the NDW DALI Rankings, users will see if a potential rebound in the back half of March may provide a catalyst for a bounce up in rankings for the asset class. Closing out the month on a negative note could provide additional fodder for the recent leadership change to the top of the DALI asset class rankings.


| Symbol | Name | Price | Yield | PnF Trend | RS Signal | RS Col. | Fund Score | 200 Day MA | Weekly Mom |
|---|---|---|---|---|---|---|---|---|---|
| DIA | State Street SPDR Dow Jones Industrial Average ETF Trust | 467.48 | 1.40 | Positive | Sell | X | 3.47 | 464.61 | - 5W |
| EEM | iShares MSCI Emerging Markets ETF | 56.95 | 1.94 | Positive | Buy | X | 5.27 | 53.36 | - 2W |
| EFA | iShares MSCI EAFE ETF | 97.46 | 3.08 | Positive | Sell | X | 3.99 | 94.37 | - 2W |
| IJH | iShares S&P MidCap 400 Index Fund | 67.00 | 1.25 | Positive | Buy | O | 4.11 | 65.63 | - 3W |
| IJR | iShares S&P SmallCap 600 Index Fund | 122.20 | 1.33 | Positive | Sell | O | 3.08 | 118.71 | - 4W |
| QQQ | Invesco QQQ Trust | 597.26 | 0.46 | Positive | Buy | O | 4.23 | 590.64 | - 11W |
| RSP | Invesco S&P 500 Equal Weight ETF | 193.53 | 1.53 | Positive | Sell | O | 2.91 | 189.73 | - 2W |
| SPY | State Street SPDR S&P 500 ETF Trust | 666.06 | 1.06 | Positive | Buy | X | 4.70 | 658.24 | - 11W |
| XLG | Invesco S&P 500 Top 50 ETF | 56.37 | 0.67 | Positive | Buy | O | 4.05 | 56.30 | - 11W |

Average Level
-22.72
| < - -100 | -100 - -80 | -80 - -60 | -60 - -40 | -40 - -20 | -20 - 0 | 0 - 20 | 20 - 40 | 40 - 60 | 60 - 80 | 80 - 100 | 100 - > |
|---|---|---|---|---|---|---|---|---|---|---|---|
|
Buy signalSPY
|
|||||||||||
|
Buy signalVOOV
|
|||||||||||
|
Buy signaliwm
|
|||||||||||
|
Buy signalijr
|
|||||||||||
|
Sell signalXLG
|
|||||||||||
|
Buy signalrsp
|
|||||||||||
|
Buy signalIJH
|
|||||||||||
|
Sell signalONEQ
|
|||||||||||
|
Buy signalhyg
|
Buy signaldia
|
Sell signalVOOG
|
|||||||||
|
Buy signalshy
|
Sell signalagg
|
Buy signalief
|
Buy signalQQQ
|
Buy signalGLD
|
Sell signaldx/y
|
Buy signalGSG
|
|||||
|
Sell signallqd
|
Buy signalfxe
|
Buy signalefa
|
Buy signalEEM
|
Sell signaltlt
|
Buy signaldvy
|
Buy signalicf
|
Buy signalGCC
|
Buy signalUSO
|
|||
| < - -100 | -100 - -80 | -80 - -60 | -60 - -40 | -40 - -20 | -20 - 0 | 0 - 20 | 20 - 40 | 40 - 60 | 60 - 80 | 80 - 100 | 100 - > |
| AGG | iShares US Core Bond ETF |
| USO | United States Oil Fund |
| DIA | SPDR Dow Jones Industrial Average ETF |
| DVY | iShares Dow Jones Select Dividend Index ETF |
| DX/Y | NYCE U.S.Dollar Index Spot |
| EFA | iShares MSCI EAFE ETF |
| FXE | Invesco CurrencyShares Euro Trust |
| GLD | SPDR Gold Trust |
| GSG | iShares S&P GSCI Commodity-Indexed Trust |
| HYG | iShares iBoxx $ High Yield Corporate Bond ETF |
| ICF | iShares Cohen & Steers Realty ETF |
| IEF | iShares Barclays 7-10 Yr. Tres. Bond ETF |
| LQD | iShares iBoxx $ Investment Grade Corp. Bond ETF |
| IJH | iShares S&P 400 MidCap Index Fund |
| ONEQ | Fidelity Nasdaq Composite Index Track |
| QQQ | Invesco QQQ Trust |
| RSP | Invesco S&P 500 Equal Weight ETF |
| IWM | iShares Russell 2000 Index ETF |
| SHY | iShares Barclays 1-3 Year Tres. Bond ETF |
| IJR | iShares S&P 600 SmallCap Index Fund |
| SPY | SPDR S&P 500 Index ETF Trust |
| TLT | iShares Barclays 20+ Year Treasury Bond ETF |
| GCC | WisdomTree Continuous Commodity Index Fund |
| VOOG | Vanguard S&P 500 Growth ETF |
| VOOV | Vanguard S&P 500 Value ETF |
| EEM | iShares MSCI Emerging Markets ETF |
| XLG | Invesco S&P 500 Top 50 ETF |
| Symbol | Company | Sector | Current Price | Action Price | Target | Stop | Notes |
|---|---|---|---|---|---|---|---|
| ABBV | AbbVie Inc. | Drugs | $225.37 | 210s - low 230s | 284 | 188 | 5 for 5'er, favored DRUG sector, LT pos peer & mkt RS, breakout from consec sell signals, 2.9% yield |
| AB | AllianceBernstein Holding LP | Wall Street | $37.96 | low 40s | 64 | 32 | 3 TA rating, LT mkt RS buy, LT pos trend, top 50% of WALL sector matrix, consec buy signals, buy-on-pullback, yield > 8% |
| ZWS | Zurn Elkay Water Solutions Corp. | Machinery and Tools | $45.86 | hi 40s - lo 50s | 95 | 42 | 5 TA rating, LT pos trend, LT mkt RS buy, consec buy signals, buy-on-pullback |
| CACI | CACI International Inc. | Computers | $612.63 | 570s - 600s | 672 | 528 | 5 for 5'er, top 25% of COMP sector matrix, LT pos mkt RS, triple top breakout |
| WBS | Webster Financial Corporation | Banks | $67.90 | hi 60s - low 70s | 91 | 58 | 4 for 5'er, top 25% of BANK sector matrix, one box from peer RS buy, buy on pullback, 2.2% yield |
| MCK | McKesson Corporation | Drugs | $944.36 | 396-hi 470s | 1304 | 752 | 5 TA rating, top 33% of DRUG sector matrix, LT RS buy, consec buy signals, buy-on-pullback |
| CGON | CG Oncology, Inc. | Biomedics/Genetics | $62.96 | hi 50s - low 60s | 80 | 50 | 5 for 5'er, 18 of 162 in BIOM sector matrix, bullish catapult, good R-R, Earn. 3/26 |
| AZN | Astrazeneca Group PLC Ads (United Kingdom) ADR | Drugs | $192.50 | mid 180s - upper 190s | 236 | 160 | 4 for 5'er, top 25% of DRUG sector matrix, LT pos peer RS, one box from mkt RS buy, bullish triangle |
| RTX | RTX Corp. | Aerospace Airline | $203.04 | upper 190s to mid 210s | 254 | 166 | 4/5'er; top third of Aero matrix; Peer RS within 1 box of RS buy; ATHs on 3/2. |
| COCO | Vita Coco Company, Inc. | Food Beverages/Soap | $57.99 | mid-to-hi 50s | 72 | 48 | 5 for 5'er, top half of FOOD sector matrix, LT pos peer & mkt RS, pos trend flip |
| DGII | Digi International Inc | Telephone | $49.39 | upper 40s to lower 50s | 61 | 40 | 5 for 5'er; top quartile of Telephone matrix; buy signal since May '25, pos. trend since June '25. |
| ASND | Ascendis Pharma A/S | Biomedics/Genetics | $228.95 | 220s - low 230s | 282 | 188 | 4 for 5'er, top third of BIOM sector matrix, LT pos peer & mkt RS, bullish triangle, buy on pullback |
| Symbol | Company | Sector | Current Price | Action Price | Target | Stop | Notes |
|---|---|---|---|---|---|---|---|
| CPRT | Copart Incorporated | Autos and Parts | $33.97 | hi 30s | 28 | 42 | 1 TA rating, bottom 50% of AUTO sector matrix, NT and mkt RS sell last month, consec sell signals |
| Comment | |||||||
|---|---|---|---|---|---|---|---|
|
|
|||||||
ASND Ascendis Pharma A/S R ($225.42) - Biomedics/Genetics - ASND is a 4 for 5'er that ranks in the top third of the biomedics/genetics sector matrix and has been on peer and market RS buy signals since 2023 and 2024, respectively. On its default chart, ASND has completed three consecutive buy signals, most recently completing a bullish triangle that carried the stock to a new all-time high. ASND has subsequently pulled back to near the middle of its trading band, offering an entry point for long exposure. Positions may be added in the $220s to low $230s and we will set our initial stop at $188, which would take out multiple levels of support on ASND's chart. We will use the bullish price objective, $ $282, as our target price.
| 26 | |||||||||||||||||||||||||||||
| 248.00 | X | 248.00 | |||||||||||||||||||||||||||
| 244.00 | X | O | 244.00 | ||||||||||||||||||||||||||
| 240.00 | X | X | O | 240.00 | |||||||||||||||||||||||||
| 236.00 | X | O | X | 3 | O | 236.00 | |||||||||||||||||||||||
| 232.00 | • | X | O | X | O | X | O | 232.00 | |||||||||||||||||||||
| 228.00 | X | • | X | O | X | O | X | O | 228.00 | ||||||||||||||||||||
| 224.00 | • | X | O | • | X | O | X | O | X | 224.00 | |||||||||||||||||||
| 220.00 | X | • | • | X | O | • | X | X | 2 | X | O | Mid | 220.00 | ||||||||||||||||
| 216.00 | X | X | O | X | • | • | X | O | X | X | O | X | O | X | 216.00 | ||||||||||||||
| 212.00 | X | O | X | O | X | O | X | • | X | O | X | O | X | O | X | O | 212.00 | ||||||||||||
| 208.00 | X | O | X | X | X | O | X | O | X | O | X | O | X | O | X | O | X | • | 208.00 | ||||||||||
| 204.00 | X | O | X | O | X | O | X | O | C | X | O | X | O | X | 1 | X | O | • | 204.00 | ||||||||||
| 200.00 | A | O | X | O | X | O | X | • | O | O | X | O | X | O | X | • | 200.00 | ||||||||||||
| 198.00 | X | X | O | X | B | X | O | X | • | O | X | O | • | O | X | • | 198.00 | ||||||||||||
| 196.00 | X | O | X | O | X | O | O | • | O | X | • | O | X | • | 196.00 | ||||||||||||||
| 194.00 | X | O | X | O | X | • | O | • | O | X | • | 194.00 | |||||||||||||||||
| 192.00 | X | O | X | O | X | • | • | O | X | • | 192.00 | ||||||||||||||||||
| 190.00 | X | O | X | O | X | • | O | • | 190.00 | ||||||||||||||||||||
| 188.00 | O | • | O | • | • | 188.00 | |||||||||||||||||||||||
| 26 |

| AAPL Apple Inc. ($250.29) - Computers - Shares of AAPL broke a double bottom at $252 for its first sell signal since April of last year, completing a bearish triangle in the process. That said, AAPL remains a solid 5 for 5'er given its relative strength and positive trend. The weight of the evidence for the stock continues to be positive despite the recent dip. Those with exposure should continue to hold until it sees further downside, such as movement into a negative trend. Initial support lies at $244 then $228, with the bullish support line at $224. |
| B Barrick Mining Corporation ($42.32) - Precious Metals - B fell to a sell signal Friday when it broke a triple bottom at $43, where it now sits against prior support. The outlook for the stock remains favorable as B is a 4 for 5'er that ranks near the middle of the precious metals sector matrix. However, beyond the current support at $43, B show's no further support on its default chart until $31. |
| GIL Gildan Activewear ($58.77) - Textiles/Apparel - GIL broke a double bottom at $59 to complete a bearish catapult and bring the stock down to test the bullish support line. The stock remains a 5 for 5'er and ranks within the top quintile of the Textiles/Apparel sector matrix. From here, support lies at $58, the bullish support line, which would be violated with a move below $57. Additional support lies at in the mid to lower $50s. |
| META Meta Platform Inc. ($612.47) - Internet - Break to the downside for META today, as the four for fiver broke a quadruple bottom with intraday action. The name is still technically acceptable, although the break to the downside is certainly worth watching closely. From here, the next level of support is found at the bullish support line at $608. To the upside, there are several layers of resistance between $656 and $744. |
| SPHR Sphere Entertainment Co. ($105.13) - Leisure - SPHR broke a double bottom at $108 for a second sell signal since peaking at $120 as shares fell to $106. The stock remains a 5 for 5'er and ranks 2nd out of 64 within the Leisure sector matrix. From here, prior resistance at $100 may be seen as near-term support, while additional support can be found in the upper $80s. |
| Name | Option Symbol | Action | Stop Loss |
|---|---|---|---|
| Advance Auto Parts, Inc. - $51.73 | O: 26D50.00D17 | Buy the April 50.00 calls at 4.70 | 48.00 |
| Name | Option | Action |
|---|---|---|
| Apple Inc. ( AAPL) | Apr. 270.00 Calls | Stopped at 252.00 (CP: 250.93) |
| Name | Option Symbol | Action | Stop Loss |
|---|---|---|---|
| Airbnb, Inc. Class A - $126.30 | O: 26Q130.00D15 | Buy the May 130.00 puts at 11.30 | 140.00 |
| Name | Option | Action |
|---|---|---|
| Chipotle Mexican Grill 'A' ( CMG) | Mar. 37.50 Puts | Initiate an option stop loss of 2.90 (CP: 4.90) |
| Chipotle Mexican Grill 'A' ( CMG) | Mar. 37.50 Puts | Raise the option stop loss to 2.90 (CP: 4.90) |
| Tractor Supply Company ( TSCO) | Apr. 55.00 Puts | Raise the option stop loss to 4.10 (CP: 6.10) |
| General Mills, Inc. ( GIS) | Jun. 47.50 Puts | Raise the option stop loss to 6.10 (CP: 8.10) |
| Copart Incorporated ( CPRT) | May. 40.00 Puts | Raise the option stop loss to 3.90 (CP: 5.90) |
| Best Buy Co., Inc. ( BBY) | May. 67.50 Puts | Raise the option stop loss to 5.20 (CP: 7.20) |
| Zoetis Inc. ( ZTS) | Jul. 120.00 Puts | Raise the option stop loss to 8.60 (CP: 10.60) |
| Name | Option Sym. | Call to Sell | Call Price | Investment for 500 Shares | Annual Called Rtn. | Annual Static Rtn. | Downside Protection |
|---|---|---|---|---|---|---|---|
| DHT Holdings, Inc. $ 16.84 | O: 26E17.00D15 | May. 17.00 | 16.85 | $ 7,865.75 | 40.51% | 41.19% | 6.64% |
| Name | Action |
|---|---|
| Intel Corporation ( INTC) - 45.25 | Sell the May 49.00 Calls. |
| Freeport-McMoRan Inc. ( FCX) - 59.21 | Sell the June 65.00 Calls. |
| Micron Technology, Inc. ( MU) - 405.35 | Sell the June 420.00 Calls. |
| Moderna, Inc. ( MRNA) - 53.39 | Sell the April 55.00 Calls. |
| Fortinet Inc. ( FTNT) - 84.40 | Sell the May 85.00 Calls. |
| CAVA Group, Inc. ( CAVA) - 80.35 | Sell the April 80.00 Calls. |
| Devon Energy Corporation ( DVN) - 46.19 | Sell the June 47.50 Calls. |
| Name | Covered Write |
|---|---|
| Cameco Corporation ( CCJ - 115.30 ) | April 120.00 covered write. |
Daily Equity & Market Analysis
LISTEN TO PODCAST
Mar 12, 2026
Loading, Please Wait...
