Most Requested Symbols

Whether you are new to the Dorsey Wright platform, or have been a loyal subscriber for years, we invite you to join us for our Summer School Series. We have designed a six-part webinar course in an effort to help make every user more efficient in their daily navigation of the DWA website and research tools. Each recorded webinar session will be posted here in the "Were You Aware..." every Tuesday between now and Labor Day. You can watch them each week, or save them to review at your leisure throughout the year. The "syllabus" is outlined below, and Modules 1 through 3 have been completed.
Module 1: Point & Figure Chart Basics
Module 2: Monitoring Positions
Module 3: Idea Generation
Module 4: The Power of Relative Strength
Module 5: Using DALI in Portfolios
Module 6: Options Give You Options

Throughout 2017 deterioration within the U.S. Dollar has been among the primary themes in focus, and understanding the Dollar’s impact on the positions in our portfolios is important. Coming into 2017, investors found themselves within a rising dollar environment, as the NYCE U.S. Dollar Spot Index DX/Y had reached a 14-year high. The greenback has since deteriorated over the last eight months, so today we will provide a broad update on the technical picture of the U.S. Dollar and also discuss the Dollar’s impact on the broad asset classes.
What is the US Dollar Index (DX/Y)?
To begin we should first explain that the US Dollar Index DX/Y is priced in terms of a weighted basket of major foreign currencies. When we refer to moves in "the dollar," it is this index to which we are referring. The US Dollar Index is a geometrically-averaged calculation of six currencies weighted against the US dollar, which has been in existence since 1973. Futures Contracts were listed on the Index back in 1985 and only one major reconstitution of the Index has taken place since that time, a move to include the Euro.
Today the US Dollar Index contains six component currencies, which are "trade-weighted": the Euro, Japanese Yen, British Pound, Canadian Dollar, Swedish Krona and Swiss Franc. Prior to the formation of the Euro FX, the US Dollar Index contained ten currencies, including as well the West German Mark, French Franc, Italian Lira, Dutch Guilder and Belgium Franc. Today the currency weights contributing to the pricing of this Index are as follows:
Currency Weights:
By the end of July the NYCE U.S. Dollar Spot Index DX/Y was sitting at the $93 level, which is more than 10% off of the chart high at $103.50. As a result, we are now effectively in a falling dollar environment. Prior to this transition, the U.S. Dollar had been in a rising dollar environment since May 4th, 2011, which is the longest rising dollar period we have seen since 1985. Although we do find ourselves now in a falling dollar environment it is worth noting that the DX/Y chart has registered some of the lowest weekly distribution readings since September 2012. Additionally, while there have been support levels violated along the way, the May 2016 low at $92 is still intact on the chart. All of this is to say that the potential for a bounce is possible, and investors should not necessarily make big shifts in their allocations based on just the 10% correction alone. As we’ll discuss in the U.S. Dollar Study below certain asset classes fair better than others during falling dollar environments, while others aren’t impacted to a significant degree.

Our data on this NYCE U.S. Dollar Spot Index goes back to the point in time when a liquid market was created for this calculation of the Dollar with the inception of futures contracts on the U.S. Dollar Index (in 1985). Since that time we have seen many significant moves for the Dollar, and we would like to focus on identifying any meaningful correlation between other major asset classes and moves in the underlying currency markets. In other words, do some assets perform better with consistency in a rising dollar market, and vice versa?
Traditional measures of correlation would look at daily or monthly returns of some security, the Dollar for example, and then match up the returns of something else (a bond index perhaps) in the same manner. If bonds were generally up during the same sessions that the Dollar posted gains, they would be considered positively correlated. If bonds were generally down during days (or months) when the Dollar was up, they would be considered inversely correlated. Such data is available elsewhere and didn't truly provide the type of research we wanted to provide to you. Before we began to study this we set out a definition for "rising dollar market", versus a "falling dollar market."
Study Parameters:

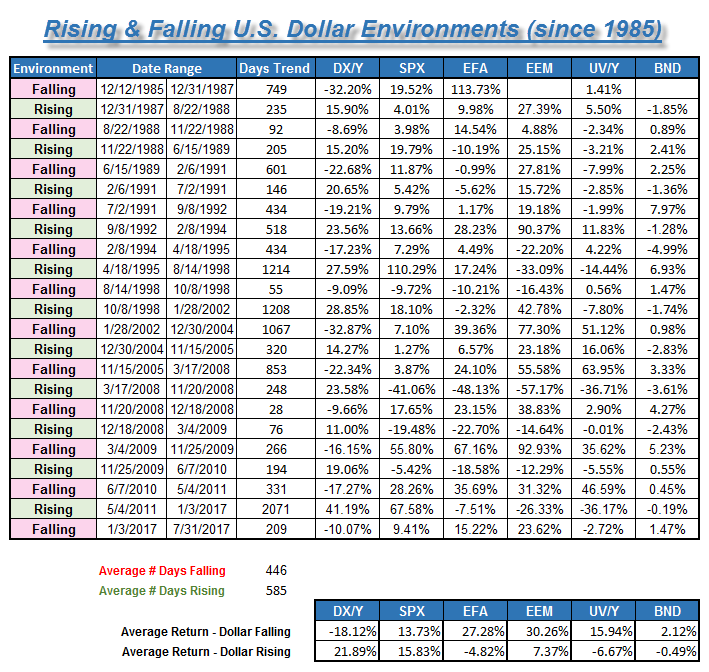
Over the last 32 years, there have been a total of 11 rising dollar markets and 12 falling dollar markets (including the recent "rising" stint, which began on May 4th, 2011 and ended January 3rd, 2017) using our basic criteria. The average duration of a (rising or falling) cycle is 516 days, and results in average moves of about +/- 20% in each direction (keep in mind that the manner in which these trends were calculated means that no trend could have resulted in a move materially less than 10% in either direction). After this record of +2,000 days the average number of days for a rising dollar environment pushed up to 585. The return for DX/Y during this particular rising environment was +41.19% (5/4/11 to 1/3/17), which is well above the +22% historical average. Below we offer you a recap of all the historical rising and falling dollar environments, and associated returns for DX/Y, in addition to other pertinent benchmarks.
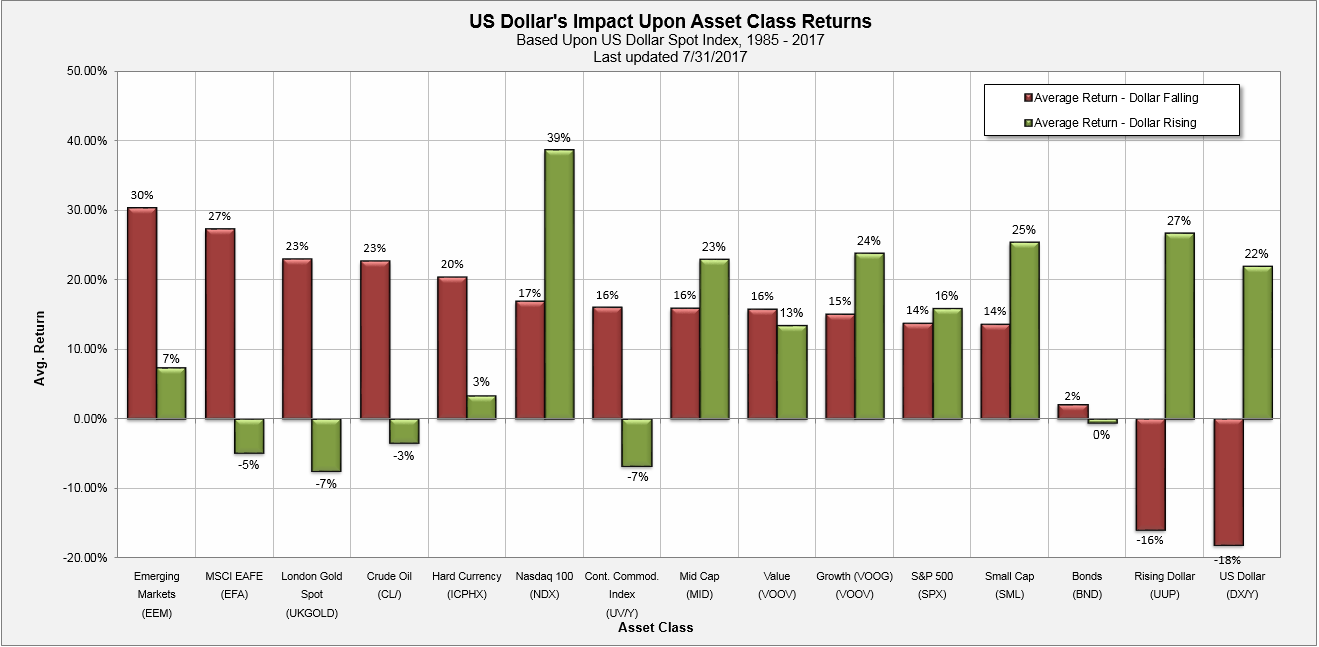
Having identified "rising dollar" and "falling dollar" environments going back to 1985, the next step was to look at various asset classes and their respective performance during these markets. To accomplish this we chose investment vehicles representing Domestic Equity, International Equity, Emerging Markets, Domestic Fixed Income, Foreign Currency, Various Equity Styles (Large, Mid, Small, Value, and Growth), and Commodities. The results were interesting as many assets did show meaningful performance biases during either rising or falling dollar markets. The red bars in the graphics below represent average performance during all falling dollar markets, while the green bars represent average performance by that same asset class during all rising dollar markets. For some assets we did not have data going back to 1985, so returns reflect the average since the time at which we had data (those dates are denoted). In the bullet points below, we have highlighted the notable takeaways about falling dollar environments.
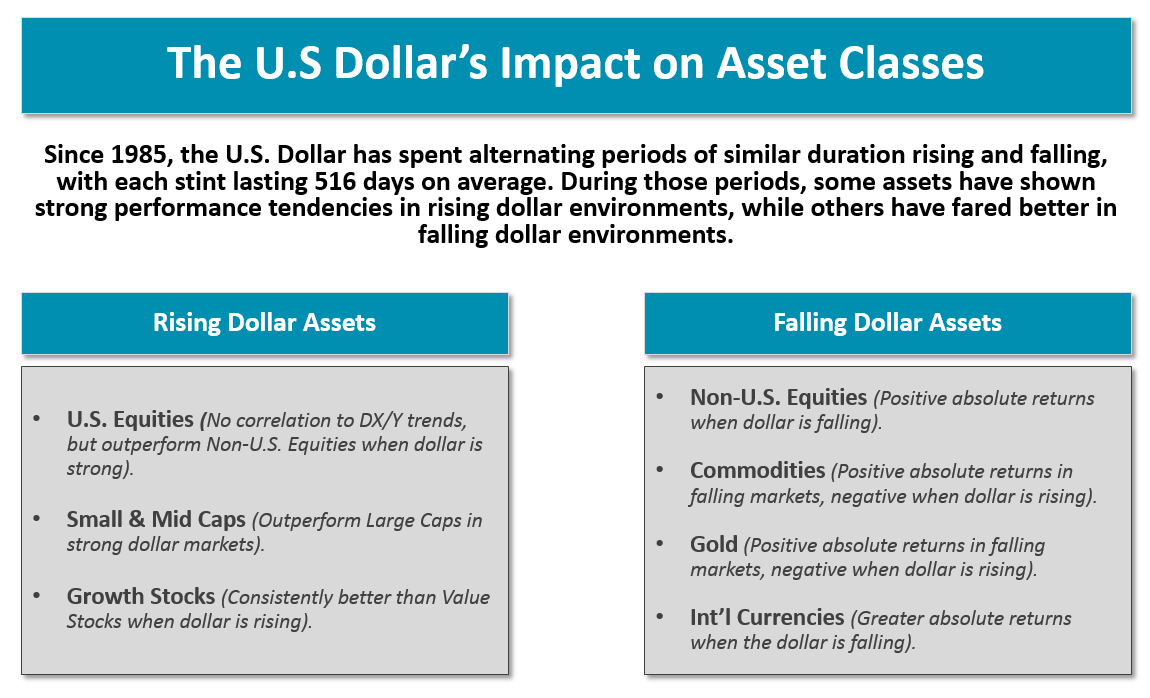
Observations:
So what does the information in the study mean for our portfolios today? At this point we would consider it less of a call to action and more of a cause for attention. We continue to see Domestic Equities hang on to their superior relative strength over all other asset classes. While International Equities have been rallying hard to close that gap, they will need another 50 buy signals to do so. This is not outside of the realistic realm of possibilities over the course of the next few months. Although, Commodities and Currencies do fair well on average in falling dollar environments, the RS trends don't corroborate that story at this time.

Every week, the analysts here at DWA organize and write approximately 11 feature stories focusing within the inventories of multiple ETF providers. These articles can be found within the weekly ETF reports we conduct for those ETF families with which we provide guided model-based solutions. The weekly reports can be accessed from the Research Menu, but as of this week we will also compile a handful of those stories, which we feel are particularly relevant. We hope that this will serve as an "in case you missed it..." sort of section, where you can quickly access timely ETF features in a comprehensive fashion each week. We will include a link to the report along with a brief abstract summarizing our discussion within the respective features. This week's compilation is below.

International Equities remains the most improved asset class on a year-to-date basis, led by Emerging Europe and Developed Asia. One area of strength in particular within the International space comes from China-related funds, which currently have an average group score of 5.02, trailing just India-related funds (5.04) in the non-US view on the Asset Class Group Scores page. One fund that has participated to the upside is the Guggenheim China Small Cap ETF HAO. HAO is up over 23% year-to-date, compared to the MSCI World ex-US Index MSCIWORLDXUS, up 14.73%. With yesterday’s intra… (Read More)
While the broad Energy sector continues to struggle because of weakness in Oil, the clean energy and energy infrastructure sectors have displayed signs of strength. For example, in the First Trust Matrix Review section of this report, notice how the Energy funds are ranked at the bottom, as the First Trust Energy AlphaDEX Fund FXN, First Trust Natural Gas FCG, and the First Trust NASDAQ Oil & Gas ETF FTXN, are ranked in the bottom three positions within the matrix and are all scoring below 1. Meanwhile, the First Trust NASDAQ Clean Edge Green Energy... (Read More).
The broad Healthcare sector is the most improved group within the sector level of DALI, up more than 50 buy signals year-to-date. The sector was able to make its way back into the top 4 rankings by the end of June, and was thus added to the Power4 model last month. It was able to maintain its margin of leadership over other sectors... (Read More).
The Distribution Report below places Major Market ETFs and Indices into a bell curve style table based upon their current location on their 10-week trading band. The middle of the bell curve represents areas of the market that are "normally" distributed, with the far right being 100% overbought on a weekly distribution and the far left being 100% oversold on a weekly distribution. The weekly distribution ranges are calculated at the end of each week, while the placement within that range will fluctuate during the week. In addition to information regarding the statistical distribution of these market indexes, a symbol that is in UPPER CASE indicates that the RS chart is on a Buy Signal. If the symbol is dark Green then the stock is on a Point & Figure buy signal, and if the symbol is bright Red then it is on a Point & Figure sell signal.
The average Bullish Percent reading this week is 56.17% down 2.02% from the previous week
| <--100 | -100--80 | -80--60 | -60--40 | -40--20 | -20-0 | 0-20 | 20-40 | 40-60 | 60-80 | 80-100 | 100-> | |||
 |
||||||||||||||
| Symbol | Name | Symbol | Name |
| AGG | iShares US Core Bond ETF | NASD | Nasdaq Composite |
| CL/ | Crude Oil Continuous | NDX | NASDAQ-100 Index |
| DJIA | Dow Jones Industrial Average | RSP | Guggenheim S&P 500 Equal Weight ETF |
| DVY | iShares Dow Jones Select Dividend Index | RUT | Russell 2000 Index |
| DX/Y | NYCE U.S.Dollar Index Spot | SHY | iShares Barclays 1-3 Year Tres. Bond Fund |
| EFA | iSharesMSCI EAFE Index Fund | SML | S&P 600 Small Cap Index |
| FXE | CurrencyShares Euro Trust | SPX | S & P 500 Index |
| GC/ | Gold Continuous | TLT | iShares Barclays 20+ Year Treasury Bond Fund |
| GSG | iShares S&P GSCI Commodity-Indexed Trust | UV/Y | Continuous Commodity Index |
| HYG | iShares iBoxx $ High Yield Corporate Bond ETF | VOOG | Vanguard S&P 500 Growth ETF |
| ICF | iShares Cohen & Steers Realty Index | VOOV | Vanguard S&P 500 Value ETF |
| IEF | iShares Barclays 7-10 Yr. Tres. Bond Fund | VWO | Vanguard FTSE Emerging Markets ETF |
| LQD | iShares iBoxx $ Investment Grade Corp. | XLG | Guggenheim S&P 500 Top 50 ETF |
| MID | S&P 400 MidCap Index |

| Stock | Symbol | Sector | Current Price | Action Price | Target | Stop | Notes |
|---|---|---|---|---|---|---|---|
| Exact Sciences Corporation | EXAS | Biomedics/Genetics | $39.20 | 34-39 | n/a | 29 | 5/5'er, Top 20 ranking in Biotech matrix, Positive Diverger |
| Harris Corporation | HRS | Telephone | $117.38 | 110-116 | n/a | 99 | 5 for 5'er, top 25% of sector matrix, bullish pattern, pos wkly mom |
| Eldorado Resorts Inc | ERI | Gaming | $20.20 | 20-22 | 31 | 17 | 5 for 5'er, favored Gaming sector, potential Bull Catapult at $22, healthy R-R. |
| Tesla Inc. | TSLA | Autos and Parts | $355.17 | 320-348 | 490 | 300 | 5/5'er, Top 10 ranking in AUTO matrix, New RS buy signals, Pot. Covered Write (Nov 350 calls). |
| J.P. Morgan Chase & Co. | JPM | Banks | $94.02 | low 90s | 119 | 81 | 5 for 5'er, favored Banks sector, pullback from new highs, R-R >2, yield >2, completed bull catapult at $95 |
| Servicenow Inc | NOW | Software | $108.76 | 104-112 | TOP | 99/90 | 5 for 5'er, leader in favored SOFT sector, consistent bullish pattern |
| Monolithic Power Systems Inc. | MPWR | Semiconductors | $102.77 | 99-108 | 129 | 93 | 4/5'er, Potential bullish catapult formation, "Buy on Pullback" opportunity. |
| Digital Realty Trust, Inc. | DLR | Real Estate | $114.56 | $118/BO | N/A | 108/100 | 4 for 5'er, leader in favored REAL sector, yield > 3%, potential shakeout |
| Orbital ATK Inc. | OA | Aerospace Airline | $106.47 | 100-106 | 139 | 90 | 4/5'er, Big Base Breakout, Member of highly ranked Aerospace sector. |
| American Financial Group Inc | AFG | Insurance | $104.87 | 100-106 | 114.5 | 92 | 5 for 5'er, leader in favored Insurance sector, pos wkly mom 1 week, bullish chart pattern |
| Microchip Technology Incorporated | MCHP | Semiconductors | $84.98 | mid-80s | 92 inc. | 75 | 4/5'er, Pos. Weekly Momentum change, Recent RS buy signal. |
| Activision Blizzard, Inc. | ATVI | Software | $62.51 | lo 60's | 81 | 53 | 5 for 5'er, leader in favored Software sector, pos wkly mom 2 wks, R-R > 2 |
| Stock | Symbol | Sector | Current Price | Action Price | Target | Stop | Notes |
|---|---|---|---|---|---|---|---|
| United Natural Foods, Inc. | UNFI | Food Beverages/Soap | $37.23 | (36-40) | 16 | 45 | 0/5'er, New RS Sell Signal, Unfavored sector, Bounce to middle of trading band. |
| Cal-Maine Foods, Inc. | CALM | Food Beverages/Soap | $36.85 | (36-38) | 25 | 41 | 0 for 5'er, laggard in unfavored FOOD sector, recent new low, negative diverger |
| Comment |
|---|
| HSIC Henry Schein, Inc. R ($174.02) - Healthcare - The reversal down from a lower top, negates the potential shakeout pattern for HSIC. Traders can look to $172, the second consecutive sell signal, as a new stop point. Otherwise we will continue to raise investor stops with the trend line, which is now $160. |
| GWR Genesee & Wyoming Inc R ($67.20) - Transports/Non Air - Those with open short positions from the recommendation back in May can look to lower buy stops to $70, a potential spread quadruple top and positive trend change. |
ATVI Activision Blizzard, Inc. R ($61.33) - Software - It's been nearly a year since ATVI was recommended as a long idea, and it has continued to progress in a positive manner. So much so that we will once again add it to the roster for new long positions. The stock is a 5 for 5'er and ranks #5 out of 96 stocks in the favored Software sector. It recently broke out to new highs at $64, completing a triple top in the process. A pullback to the low 60's makes it actionable at current levels. We will look to $53 as a stop, and $81 as the upside target based on the bullish price objective.
| 09 | 10 | 11 | 12 | 13 | 14 | 15 | 16 | 17 | |||||||||||||||||||||||||||||||||||||||||||||
| 64.00 | 8 | 64.00 | |||||||||||||||||||||||||||||||||||||||||||||||||||
| 63.00 | X | 63.00 | |||||||||||||||||||||||||||||||||||||||||||||||||||
| 62.00 | X | 62.00 | |||||||||||||||||||||||||||||||||||||||||||||||||||
| 61.00 | X | X | X | 61.00 | |||||||||||||||||||||||||||||||||||||||||||||||||
| 60.00 | X | 6 | O | X | O | X | 60.00 | ||||||||||||||||||||||||||||||||||||||||||||||
| 59.00 | X | O | X | O | X | O | X | Med | 59.00 | ||||||||||||||||||||||||||||||||||||||||||||
| 58.00 | X | O | X | O | X | O | X | 58.00 | |||||||||||||||||||||||||||||||||||||||||||||
| 57.00 | X | X | O | O | X | O | X | 57.00 | |||||||||||||||||||||||||||||||||||||||||||||
| 56.00 | X | O | X | O | 7 | 56.00 | |||||||||||||||||||||||||||||||||||||||||||||||
| 55.00 | X | O | X | 55.00 | |||||||||||||||||||||||||||||||||||||||||||||||||
| 54.00 | X | O | 54.00 | ||||||||||||||||||||||||||||||||||||||||||||||||||
| 53.00 | 5 | 53.00 | |||||||||||||||||||||||||||||||||||||||||||||||||||
| 52.00 | X | 52.00 | |||||||||||||||||||||||||||||||||||||||||||||||||||
| 51.00 | 4 | Bot | 51.00 | ||||||||||||||||||||||||||||||||||||||||||||||||||
| 50.00 | X | 50.00 | |||||||||||||||||||||||||||||||||||||||||||||||||||
| 49.00 | X | 49.00 | |||||||||||||||||||||||||||||||||||||||||||||||||||
| 48.00 | 3 | 48.00 | |||||||||||||||||||||||||||||||||||||||||||||||||||
| 47.00 | X | 47.00 | |||||||||||||||||||||||||||||||||||||||||||||||||||
| 46.00 | X | 46.00 | |||||||||||||||||||||||||||||||||||||||||||||||||||
| 45.00 | X | X | 45.00 | ||||||||||||||||||||||||||||||||||||||||||||||||||
| 44.00 | X | O | X | 44.00 | |||||||||||||||||||||||||||||||||||||||||||||||||
| 43.00 | X | 9 | O | X | 43.00 | ||||||||||||||||||||||||||||||||||||||||||||||||
| 42.00 | X | O | X | B | X | 42.00 | |||||||||||||||||||||||||||||||||||||||||||||||
| 41.00 | X | O | X | O | 2 | 41.00 | |||||||||||||||||||||||||||||||||||||||||||||||
| 40.00 | 7 | O | O | X | 40.00 | ||||||||||||||||||||||||||||||||||||||||||||||||
| 39.00 | C | X | X | O | 1 | 39.00 | |||||||||||||||||||||||||||||||||||||||||||||||
| 38.00 | X | O | X | O | X | O | X | 38.00 | |||||||||||||||||||||||||||||||||||||||||||||
| 37.00 | X | X | O | X | O | X | O | X | 37.00 | ||||||||||||||||||||||||||||||||||||||||||||
| 36.00 | B | O | X | 1 | 5 | 6 | C | 36.00 | |||||||||||||||||||||||||||||||||||||||||||||
| 35.00 | X | O | X | O | 4 | 35.00 | |||||||||||||||||||||||||||||||||||||||||||||||
| 34.00 | X | O | O | X | 34.00 | ||||||||||||||||||||||||||||||||||||||||||||||||
| 33.00 | A | O | 3 | • | 33.00 | ||||||||||||||||||||||||||||||||||||||||||||||||
| 32.00 | X | 2 | X | • | 32.00 | ||||||||||||||||||||||||||||||||||||||||||||||||
| 31.00 | 9 | O | X | • | 31.00 | ||||||||||||||||||||||||||||||||||||||||||||||||
| 30.00 | X | O | X | • | 30.00 | ||||||||||||||||||||||||||||||||||||||||||||||||
| 29.00 | X | X | O | X | • | 29.00 | |||||||||||||||||||||||||||||||||||||||||||||||
| 28.00 | X | O | X | O | X | • | 28.00 | ||||||||||||||||||||||||||||||||||||||||||||||
| 27.00 | 8 | O | X | O | • | 27.00 | |||||||||||||||||||||||||||||||||||||||||||||||
| 26.00 | 6 | O | X | • | 26.00 | ||||||||||||||||||||||||||||||||||||||||||||||||
| 25.00 | 5 | O | • | 25.00 | |||||||||||||||||||||||||||||||||||||||||||||||||
| 24.00 | 9 | 4 | • | 24.00 | |||||||||||||||||||||||||||||||||||||||||||||||||
| 23.00 | 7 | O | X | • | 23.00 | ||||||||||||||||||||||||||||||||||||||||||||||||
| 22.00 | 6 | O | 2 | • | 22.00 | ||||||||||||||||||||||||||||||||||||||||||||||||
| 21.00 | 3 | 5 | O | B | X | • | 21.00 | ||||||||||||||||||||||||||||||||||||||||||||||
| 20.00 | X | O | X | A | X | O | X | • | 20.00 | ||||||||||||||||||||||||||||||||||||||||||||
| 19.50 | X | O | X | O | X | O | X | • | 19.50 | ||||||||||||||||||||||||||||||||||||||||||||
| 19.00 | X | 4 | O | X | 1 | X | • | 19.00 | |||||||||||||||||||||||||||||||||||||||||||||
| 18.50 | 1 | 2 | O | X | O | • | 18.50 | ||||||||||||||||||||||||||||||||||||||||||||||
| 18.00 | X | C | O | X | O | • | 18.00 | ||||||||||||||||||||||||||||||||||||||||||||||
| 17.50 | X | O | X | O | X | • | 17.50 | ||||||||||||||||||||||||||||||||||||||||||||||
| 17.00 | X | O | X | O | • | 17.00 | |||||||||||||||||||||||||||||||||||||||||||||||
| 16.50 | X | 8 | • | 16.50 | |||||||||||||||||||||||||||||||||||||||||||||||||
| 16.00 | X | X | • | 16.00 | |||||||||||||||||||||||||||||||||||||||||||||||||
| 15.50 | 5 | O | X | • | 15.50 | ||||||||||||||||||||||||||||||||||||||||||||||||
| 15.00 | 3 | O | 7 | • | 15.00 | ||||||||||||||||||||||||||||||||||||||||||||||||
| 14.50 | X | O | X | • | 14.50 | ||||||||||||||||||||||||||||||||||||||||||||||||
| 14.00 | B | X | 6 | X | • | 14.00 | |||||||||||||||||||||||||||||||||||||||||||||||
| 13.50 | X | O | X | O | • | 13.50 | |||||||||||||||||||||||||||||||||||||||||||||||
| 13.00 | • | X | X | X | O | X | • | 13.00 | |||||||||||||||||||||||||||||||||||||||||||||
| 12.50 | X | • | • | 6 | O | 8 | O | 4 | C | A | O | X | • | 12.50 | |||||||||||||||||||||||||||||||||||||||
| 12.00 | X | O | X | • | • | X | O | X | O | X | O | 7 | O | 6 | 9 | O | 2 | • | 12.00 | ||||||||||||||||||||||||||||||||||
| 11.50 | X | O | X | O | X | • | 5 | 7 | X | O | 3 | O | 6 | O | X | O | X | 6 | X | • | 11.50 | ||||||||||||||||||||||||||||||||
| 11.00 | O | X | O | X | O | 4 | O | A | X | O | X | 2 | X | O | X | 8 | X | • | 11.00 | ||||||||||||||||||||||||||||||||||
| 10.50 | O | X | C | X | O | 3 | B | X | 5 | X | O | • | 8 | • | B | • | 10.50 | ||||||||||||||||||||||||||||||||||||
| 10.00 | O | X | O | X | O | 2 | 1 | • | O | • | • | • | • | 10.00 | |||||||||||||||||||||||||||||||||||||||
| 9.50 | O | O | O | X | • | • | • | 9.50 | |||||||||||||||||||||||||||||||||||||||||||||
| 9.00 | O | X | • | 9.00 | |||||||||||||||||||||||||||||||||||||||||||||||||
| 8.50 | O | • | 8.50 | ||||||||||||||||||||||||||||||||||||||||||||||||||
| 09 | 10 | 11 | 12 | 13 | 14 | 15 | 16 | 17 |
| Comments |
|---|
| BIG Big Lots, Inc. ($50.99) - Retailing - BIG broke a quadruple top in Tuesday’s trading. This move broke through the bearish resistance line, flipping the trend positive and upticking the stock to a 4 for 5’er. Monthly momentum just flipped positive, suggesting the potential for further upside from here. Those interested in new positions can consider this entry point. BIG has recently found support at $46 and $47. Note overhead resistance at $55. Earnings expected 8/24. |
| CBPO China Biologic Products Inc. ($93.21) - Biomedics/Genetics - CBPO broke a fourth consecutive sell signal after breaking a double bottom at $94. The trend is negative here and it's a 0 for 5'er. Look elsewhere for now. No near term support left on the chart. |
| DLPH Delphi Automotive PLC ($93.92) - Autos and Parts - During Tuesday’s intraday trading session, DLPH broke a double top at $94. This stock is a 4 for 5’er within the Autos and Parts sector that has maintained a market RS buy signal since December 2012. Weekly momentum has been positive for four weeks, suggesting the potential for further upside from here. Additionally, the price target is $120, adding to the technical picture. Okay to consider DLPH on a pullback. The first sign of trouble from here comes with a move to $86, a double bottom sell signal. |
| JPM J.P. Morgan Chase & Co. ($93.68) - Banks - JPM reached a new rally high after breaking a double top at $95. The trend is positive here and it's a 5 for 5'er. Banks are also favored at this time. Okay to consider JPM here or on a pullback. The first sign of trouble would occur at $90, a double bottom break. |
| LGND Ligand Pharmaceuticals ($128.97) - Biomedics/Genetics - LGND is trading well above the bullish support line and with the most recent action, broke a double top at $126 and moved higher to $128. This stock is a strong 4 for 5’er within the favored Biomedics/Genetics sector that has a price target of $139, suggesting the potential for further upside from here. Okay to hold here or buy on a pullback as the stock is nearing the top of the 10 week trading band, indicating that it is overbought here. The first sign of trouble from here comes with a move to $114, a double bottom sell signal. |
| MRCY Mercury Computer Systems Inc ($44.55) - Computers - MRCY broke a double top at $45 on Tuesday, marking a new 52 week high. This is the sixth consecutive buy signal on the chart for this 5 for 5’er within the favored Computers sector. In fact, MRCY ranks in the top quartile of the sector RS matrix, making it one of the stronger names in this space. Okay to buy or hold here as demand is in control and the technical picture is positive. The first sign of trouble from here comes with a move to $39, a double bottom sell signal. |
| STI SunTrust Banks, Inc. ($58.05) - Banks - With the most recent action, STI broke a double top at $59, the second consecutive buy signal on the chart. This stock is a strong 5 for 5’er within the favored Banks sector that has been trading above the bullish support line since January 2012. Furthermore, the price target is $108, suggesting the potential for further upside from here. Okay to buy or hold here as demand is in control. From here, overhead resistance lies at $61 while support is at $53. |
| USCR US Concrete Inc ($78.50) - Building - After forming, but not breaking, a double top at $80, USCR broke a double bottom at $75, setting up a potential shakeout pattern on the chart. From here, the action point of the shakeout would be triggered with a reversal up into X’s and the pattern would then complete with a triple top break at $81. This stock is a strong 4 for 5’er within the favored Building sector that has seen three months of positive monthly momentum. Okay to play the pattern on the reversal up or upon completion. From here, further support lies at $68, the bullish support line. |
| WING Wingstop Inc. ($32.75) - Restaurants - WING broke a quadruple top at $34 with the most recent action. The trend is positive and it's a 4 for 5'er. Okay to consider this stock on a pullback. The first sign of trouble would occur at $28, a double bottom sell signal. |
| ZBRA Zebra Technologies Corp ($106.65) - Electronics - After a positive reaction to earnings, ZBRA broke a double top at $104 and rallied higher to $106. This stock is a strong 4 for 5’er within the favored Electronics sector that has maintained a peer RS buy signal since February 2014. Demand is in control and the technical picture is strong. From here, the first sign of trouble comes with a move to $94, a double bottom sell signal. Note overhead resistance at $108. |
| Name | Option Symbol | Action | Stop Loss |
|---|---|---|---|
| Avery Dennison Corporation - $93.40 | O:AVY 18A90.00D19 | Buy the January 90.00 calls at 6.40 | 87.00 |
| Name | Option | Action |
|---|---|---|
| Southwest Airlines Co. ( LUV) | Dec. 55.00 Calls | Stopped at 55.00 (CP: 54.81) |
| Apple Inc. ( AAPL) | Oct. 145.00 Calls | Raise the option stop loss to 14.40 (CP: 16.40) |
| Estee Lauder Companies ( EL) | Jan. 95.00 Calls | Raise the option stop loss to 6.50 (CP: 8.50) |
| Name | Option Symbol | Action | Stop Loss |
|---|---|---|---|
| Noble Energy Inc. - $25.39 | O:NBL 18M27.50D19 | Buy the January 27.50 puts at 3.50 | 31.00 |
| Name | Option | Action |
|---|---|---|
| Dril-Quip (DRQ) | Dec. 55.00 Puts | Raise the option stop loss to 10.70 (CP: 12.70) |
| Michael Kors Holdings Limited (KORS) | Nov. 37.50 Puts | Stopped at 40.00 (CP: 45.25) |
| Helmerich & Payne, Inc. (HP) | Dec. 55.00 Puts | Raise the option stop loss to 8.60 (CP: 10.60) |
| Target Corporation (TGT) | Oct. 60.00 Puts | Stopped at 59.00 (CP: 58.74) |
| Name | Option Sym. | Call to Sell | Call Price | Investment for 500 Shares | Annual Called Rtn. | Annual Static Rtn. | Downside Protection |
|---|---|---|---|---|---|---|---|
| Activision Blizzard, Inc. $62.51 | O:ATVI 18A65.00D19 | Jan. 65.00 | 61.33 | $29,140.15 | 23.32% | 11.65% | 4.97% |
| Name | Action |
|---|---|
| Box Inc. (BOX) - 18.84 | Sell the December 20.00 Calls. |
| Navistar International Corportation (NAV) - 31.67 | Sell the October 30.00 Calls. |
| Teladoc Inc. (TDOC) - 31.70 | Sell the January 35.00 Calls. |
| Carmax Group (KMX) - 65.83 | Sell the January 70.00 Calls. |
| NVIDIA Corporation (NVDA) - 172.35 | Sell the November 170.00 Calls. |
| Select Comfort Corporation (SCSS) - 33.86 | Sell the December 35.00 Calls. |
| Autodesk, Inc. (ADSK) - 109.82 | Sell the January 115.00 Calls. |
| Exact Sciences Corporation (EXAS) - 39.20 | Sell the January 41.00 Calls. |
| Boise Cascade Co (BCC) - 30.40 | Sell the January 32.50 Calls. |
| Tempur Sealy International Inc. (TPX) - 59.56 | Sell the January 65.00 Calls. |
| United Rentals, Inc. (URI) - 118.10 | Sell the January 130.00 Calls. |
| Name | Covered Write |
|---|---|
|
|
|
Daily Equity & Market Analysis
Loading, Please Wait...

