Most Requested Symbols

Which factors have put together the strongest start to 2026?
NDW Morning Pulse - July 2, 2026
Below are highlights from the NDW Morning Update Video for the morning of 7/1/26. Access the the video on the NDW Morning Update Video page.

US Equity Smart Beta
Factors commonly accessible through ETFs today are momentum, low volatility, quality, dividend achiever, and buyback strategies. All these factors are designed to pinpoint a certain investment theme within the marketplace, and systematically allocate to that theme. For instance, the “low volatility” factor is represented by the Invesco S&P 500 Low Volatility ETF (SPLV), a fund that seeks exposure to the 100 stocks with the lowest volatility in the S&P 500. Most of the factors examined offer better performance than the benchmark, the SPDR S&P 500 ETF (SPY), through certain durations. However, no single factor ETF has been the best performer every year, or even most of the years...nor has any single factor ETF been the worst performing every year or most of the years.
Factor Return Observations (US Equities)

It is About Time in the Factor, Not Trying to Time the Factor
Our goal with the research above is to illustrate the range of available factors and the necessity of discipline in applying these factors over time. We want to promote “good behavior,” as it relates to any investment process or product. This is perhaps the most important observation from the data above; we illustrated the outcomes generated by a few common behaviors using the same investment universe, and the outcomes vary dramatically.
There are the “buy and hold” outcomes, which show buyback and growth as the best performers throughout the entire timeframe, but we also know inherently what comes with a buy and hold commitment to only one group. The first three months of 2026 showcased this issue most recently as these factors struggled throughout Q1. Other examples include 2022 or 2000-2002- all tough spans for growth, tougher than many could endure. While buyback has turned it around over the last decade, there was a five year stretch from 2014-2018 where the factor didn’t crack the top half of performance rankings. This can be tough to stomach as other areas continue to excel.
Another approach is to equal weight all seven factors in a portfolio and rebalance that portfolio once a year. This gives you a baseline that notably underperforms the benchmarks over the last 10+ years. We also looked at the hypothetical behavior of buying the best-performing factor from the previous year and holding that factor for the entire next calendar year; we called this “Return Chasing,” and while no portfolio manager markets themselves this way exactly, it is an emotional bias that creeps into many investors’ psyches.
This “Return Chasing” portfolio tracks a hypothetical investor who sees that no strategy could beat the benchmark last year, so they just buy that factor for the next year. As mentioned previously, this has only “worked” in back-to-back full calendar years from 2012-2013, so return chasing hasn’t worked quite well over our back test. On a cumulative basis, return chasing has massively underperformed not only the other “strategies,” but also what buying-and-holding almost any other factor would have provided. The factors themselves are not the problem, as many create substantial alpha relative to the market. Bad behavior can create bad returns out of good products, and constantly chasing last year’s best-performing factor often exemplifies that reality.
The opposite of return chasing is the contrarian approach, which buys the worst-performing factor from the previous year and holds it for the subsequent calendar year. The “Contrarian Switching” portfolio illustrates what is missed when an investor dumps a factor for having a bad year. A good stock can become a bad stock and remain such for a long time, so a good factor is less likely to stay perennially out of favor because it should have a process of systematically eliminating bad stocks – this is evidenced by the outperformance of the “Contrarian Switching” strategy, which has beaten the "average" portfolio of equally weighted factors despite a poor stretch the last few years.
International Equity Smart Beta
These strategies can also be applied to factor representatives from international equities, which, as we can see below, demonstrate similar tendencies to their domestic counterparts. Note that the representatives below are only for developed market equities, as there has not been enough historical representation of factor exposure in emerging markets to represent a robust examination.
Factor Return Observations (Intl Equities):

Each week the analysts at NDW review and comment on all major asset classes in the global markets. Shown below is the summary or snapshot of the primary technical indicators we follow for multiple areas. Should there be changes mid-week we will certainly bring these to your attention via the report.
| Universe | BP Col & Level (actual) | BP Rev Level | PT Col & Level (actual) | PT Rev Level | HiLo Col & Level (actual) | HiLo Rev Level | 10 Week Col & Level (actual) | 10 Week Rev Level | 30 Week Col & Level (actual) | 30 Week Rev Level |
|---|---|---|---|---|---|---|---|---|---|---|
| ALL |
|
46% |
|
36% |
|
62% |
|
50% |
|
42% |
| NYSE |
|
48% |
|
48% |
|
66% |
|
52% |
|
50% |
| OTC |
|
36% |
|
32% |
|
60% |
|
48% |
|
40% |
| World |
|
42% |
|
46% |
|
|
|
44% |
|
46% |

Remember, these are technical comments only. Just as you must be aware of fundamental data for the stocks we recommend based on technical criteria in the report, so too must you be aware of important data regarding delivery, market moving government releases, and other factors that may influence commodity pricing. We try to limit our technical comments to the most actively traded contracts in advance of delivery, but some contracts trade actively right up to delivery while others taper off well in advance. Be sure you check your dates before trading these contracts. For questions regarding this section or additional coverage of commodities email james.west@nasdaq.com.
Data represented in the table below is through 6/30/2026:
| Symbol | Name | Price | PnF Trend | RS Signal | RS Col. | 200 Day MA | Weekly Mom |
|---|---|---|---|---|---|---|---|
| CL/ | Crude Oil Continuous | 69.50 | Negative | Sell | O | 73.84 | - 13W |
| DBLCIX | Deutsche Bank Liquid Commodities Index | 468.52 | Positive | Sell | O | 460.74 | - 51W |
| DWACOMMOD | NDW Continuous Commodity Index | 1140.30 | Positive | Buy | X | 1099.51 | - 6W |
| GC/ | Gold Continuous | 4022.90 | Negative | Buy | O | 4453.19 | - 8W |
| HG/ | Copper Continuous | 6.19 | Positive | Sell | X | 5.63 | - 4W |
| ZG/ | Corn (Electronic Day Session) Continuous | 412.75 | Negative | Sell | O | 437.97 | - 6W |

Average Level
4.18
| < - -100 | -100 - -80 | -80 - -60 | -60 - -40 | -40 - -20 | -20 - 0 | 0 - 20 | 20 - 40 | 40 - 60 | 60 - 80 | 80 - 100 | 100 - > |
|---|---|---|---|---|---|---|---|---|---|---|---|
|
Buy signalhyg
|
|||||||||||
|
Buy signalief
|
Buy signalEEM
|
||||||||||
|
Buy signalagg
|
Buy signaldvy
|
||||||||||
|
Sell signallqd
|
Buy signalVOOG
|
||||||||||
|
Buy signalXLG
|
Buy signalefa
|
Buy signaltlt
|
Buy signalrsp
|
||||||||
|
Sell signalgld
|
Sell signaluso
|
Sell signalshy
|
Buy signalONEQ
|
Buy signalSPY
|
Buy signalIJH
|
Buy signaldia
|
|||||
|
Buy signalgcc
|
Sell signalgsg
|
Sell signalfxe
|
Buy signalicf
|
Buy signalVOOV
|
Buy signalQQQ
|
Buy signaliwm
|
Buy signaldx/y
|
Buy signalijr
|
|||
| < - -100 | -100 - -80 | -80 - -60 | -60 - -40 | -40 - -20 | -20 - 0 | 0 - 20 | 20 - 40 | 40 - 60 | 60 - 80 | 80 - 100 | 100 - > |
| AGG | iShares US Core Bond ETF |
| USO | United States Oil Fund |
| DIA | SPDR Dow Jones Industrial Average ETF |
| DVY | iShares Dow Jones Select Dividend Index ETF |
| DX/Y | NYCE U.S.Dollar Index Spot |
| EFA | iShares MSCI EAFE ETF |
| FXE | Invesco CurrencyShares Euro Trust |
| GLD | SPDR Gold Trust |
| GSG | iShares S&P GSCI Commodity-Indexed Trust |
| HYG | iShares iBoxx $ High Yield Corporate Bond ETF |
| ICF | iShares Cohen & Steers Realty ETF |
| IEF | iShares Barclays 7-10 Yr. Tres. Bond ETF |
| LQD | iShares iBoxx $ Investment Grade Corp. Bond ETF |
| IJH | iShares S&P 400 MidCap Index Fund |
| ONEQ | Fidelity Nasdaq Composite Index Track |
| QQQ | Invesco QQQ Trust |
| RSP | Invesco S&P 500 Equal Weight ETF |
| IWM | iShares Russell 2000 Index ETF |
| SHY | iShares Barclays 1-3 Year Tres. Bond ETF |
| IJR | iShares S&P 600 SmallCap Index Fund |
| SPY | SPDR S&P 500 Index ETF Trust |
| TLT | iShares Barclays 20+ Year Treasury Bond ETF |
| GCC | WisdomTree Continuous Commodity Index Fund |
| VOOG | Vanguard S&P 500 Growth ETF |
| VOOV | Vanguard S&P 500 Value ETF |
| EEM | iShares MSCI Emerging Markets ETF |
| XLG | Invesco S&P 500 Top 50 ETF |

| Symbol | Company | Sector | Current Price | Action Price | Target | Stop | Notes |
|---|---|---|---|---|---|---|---|
| GRMN | Garmin Ltd. | Leisure | $237.54 | mid 230s - mid 260s | 364 | 196 | 5 TA rating, LT pos trend and mkt RS buy, top 33% of LEIS sector matrix, buy-on-pullback, Earn. 7/29 |
| IBOC | International Bancshares Corporation | Banks | $75.98 | low-to-mid 70s | 93 | 63 | 4 for 5'er, favored BANK sector, LT pos peer & mkt RS, bearish signal reversal, R-R~2.0, 1.95% yield |
| LYV | Live Nation Entertainment Inc. | Leisure | $183.11 | low 160s to mid 170s | 202 | 142 | 4 for 5'er; Pos. Trend; Top Half of Leisure Matrix; Within one box of ATH. |
| MO | Altria Group Inc. | Food Beverages/Soap | $71.95 | low-to-mid 70s | 91 | 62 | 4 for 5'er, top quartile of FOOD sector matrix, one box from RS buy, bullish triangle, 5.9% yield, Earn. 7/30 |
| CTRE | CareTrust REIT Inc | Real Estate | $40.35 | $38 - $43 | 62.50 | 34 | 5/5'er since Apr. '25, top quintile of Real Estate Matrix, pos. trend and buy signal since Jul. '23. |
| BTI | British American Tobacco Sp-Adr (United Kingdom) ADR | Food Beverages/Soap | $61.76 | hi 50s - low 60s | 92 | 51 | 4 for 5'er, top 25% of FOOD sector matrix, one box from mkt RS buy, buy on pullback, R-R~3.0, 5.3% yield, Earn. 7/30 |
| LAMR | Lamar Advertising Company | Media | $155.98 | mid 140 to mid 150 | 228 | 122 | 5 for 5'er, top third of Media Matrix, pos. trend, Reward-Risk > 11, current yield > 4%. |
| CM | Canadian Imperial Bank of Commerce | Banks | $115.00 | 100s | 165 | 90 | 5 for 5'er, top 10% of favored BANK sector matrix, LT pos peer RS, bearish signal reversal, R-R>3.0, 2.9% yield |
| JCI | Johnson Controls International PLC | Building | $146.11 | upper 130s to lower 150s | 182 | 124 | 4 for 5'er since Apr. '25, top 25% of Building sector matrix, pos. trend, ATH on 6/3, Earn. 7/28 |
| EBAY | eBay Inc. | Retailing | $111.75 | mid 100s - low 110s | 161 | 93 | 5 for 5'er, top 10% of RETA sector matrix, buy on pullback, R-R~3.0, Earn.. 7/29 |
| F | Ford Motor Company | Autos and Parts | $13.90 | 14.50 - 16 | 27 | 12.50 | 5 for 5'er, top 20% of AUTO sector matrix, RS buy signal, spread triple top, R-R~5, 3.9% yield, Earn. 7/29 |
| HLT | Hilton Worldwide Holdings Inc | Leisure | $330.46 | low 320 - low 340 | 452 | 284 | 5 for 5'er since Nov. '23, top half of Leisure sector matrix, pos. trend since Nov. '23, buy since April, Earn. 7/28 |
| CFG | Citizens Financial Group Inc | Banks | $70.07 | low to hi 60s | 87 | 54 | 5 for 5'er, top quintile of Banks matrix, LT pos. trend, Reward-Risk > 4, Earn. 7/16. |
| ESI | Element Solutions Inc. | Chemicals | $47.75 | low to mid 40s | 66 | 38 | 5 for 5'er, top decile of the Chemicals matrix, buy signal since 1/26, Reward-Risk > 3, Earn. 7/30 |
| MFC | Manulife Financial Corporation | Insurance | $40.51 | 37 - 42 | 63 | 32 | 5 for 5'er since 1/26, top quintile of Insurance matrix, 3rd buy and ATH on 6/16. |
| AVBP | ArriVent BioPharma, Inc. | Biomedics/Genetics | $34.74 | low 30s | 55 | 25 | 5 for 5'er, top third of Biotech matrix, pos. L-T Peer and Mkt RS, pos. trend. |
| AFL | AFLAC Incorporated | Insurance | $117.25 | hi 110s - low 120s | 136 | 104 | 4 for 5'er, top half of INSU sector matrix, LT pos mkt & peer RS, spread triple top, 2.1% yield |
| BUD | Anheuser-Busch InBev NV (Belgium) ADR | Food Beverages/Soap | $82.40 | low to mid 80s | 109 | 67 | 4 for 5'er, top decile of Food/Bev. matrix, pos. trend since Apr. '25, one box from Mkt RS buy, Earnings on 7/30. |
| AAP | Advance Auto Parts, Inc. | Autos and Parts | $62.22 | low-to-mid 60s | 80 | 54 | 5 for 5'er, top 20% of AUTO sector matrix, spread quad top, R-R~2.0, 1.8% yield |
| Symbol | Company | Sector | Current Price | Action Price | Target | Stop | Notes |
|---|
| Symbol | Company | Sector | Current Price | Action Price | Target | Stop | Notes |
|---|---|---|---|---|---|---|---|
| IRM | Iron Mountain Inc. | Business Products | $126.31 | mid 120s to mid 130s | 167 | 108 | IRM has fallen to a sell signal. OK to hold here. Maintain $108 stop. |
| DLR | Digital Realty Trust, Inc. | Real Estate | $179.58 | 190 - 200 | 230 | 172 | DLR has fallen to a sell signal. OK to hold here. Maintain $172 stop. Earn. 7/23 |
| Comment | |||||||
|---|---|---|---|---|---|---|---|
|
|
|||||||
AAP Advance Auto Parts, Inc. R ($63.15) - Autos and Parts - AAP is a 5 for 5'er that ranks in the top quintile of the autos and parts sector matrix. After successfully testing its bullish support line, AAP returned to a buy signal this week when it broke a spread quadruple top at $63. Long exposure may be added in the low-to-mid $60s and we will set our initial stop at $54, a potential spread quadruple bottom break on AAP's chart that would also violate its trend line. We will use the bullish price objective, $80, as our target price, giving us a reward-to-risk ratio of about 2.0. AAP also carries a 1.8% yield.
| 65.00 | X | • | 65.00 | ||||||||||||||||||||||||||
| 64.00 | X | O | • | 64.00 | |||||||||||||||||||||||||
| 63.00 | X | O | • | X | 63.00 | ||||||||||||||||||||||||
| 62.00 | X | O | • | X | 6 | X | X | 62.00 | |||||||||||||||||||||
| 61.00 | X | O | • | • | X | O | X | O | X | O | X | X | 61.00 | ||||||||||||||||
| 60.00 | X | O | • | X | X | • | X | O | X | O | X | O | X | O | X | 60.00 | |||||||||||||
| 59.00 | X | O | • | X | O | X | O | X | O | X | O | X | O | X | O | X | 59.00 | ||||||||||||
| 58.00 | X | O | • | X | O | X | O | X | O | X | O | X | O | O | X | Mid | 58.00 | ||||||||||||
| 57.00 | X | O | • | X | O | X | 5 | X | O | X | O | X | O | X | 57.00 | ||||||||||||||
| 56.00 | X | O | X | • | X | O | O | X | O | X | O | X | O | X | 56.00 | ||||||||||||||
| 55.00 | X | O | X | O | • | X | O | X | O | O | O | • | 55.00 | ||||||||||||||||
| 54.00 | X | O | X | O | X | X | 4 | X | O | X | • | • | 54.00 | ||||||||||||||||
| 53.00 | X | O | O | X | X | O | X | O | X | O | X | O | X | • | 53.00 | ||||||||||||||
| 52.00 | X | O | X | O | X | O | X | O | X | O | X | O | X | • | 52.00 | ||||||||||||||
| 51.00 | X | O | X | O | X | O | O | X | O | • | O | X | • | 51.00 | |||||||||||||||
| 50.00 | 2 | O | 3 | X | • | O | X | • | O | X | • | 50.00 | |||||||||||||||||
| 49.00 | O | X | O | • | O | X | • | O | X | • | 49.00 | ||||||||||||||||||
| 48.00 | O | X | • | O | X | • | O | • | 48.00 | ||||||||||||||||||||
| 47.00 | O | • | O | • | • | 47.00 |
| COST Costco Wholesale Corporation ($926.31) - Retailing - COST broke a double bottom at $928 to complete a bearish catapult. The break follows the stock reversing down into Os on both the market and peer RS charts, dropping the stock down to a 3 for 5'er. From here, the stock maintains support at $848, the bullish support line, while additional resides at $800. |
| IFF International Flavors & Fragrances Inc. ($80.80) - Chemicals - IFF returned to a buy signal Wednesday after successfully testing its bullish support line; the move adds to an moderately positive technical picture as IFF is a 3 for 5'er that ranks 10th of 49 names in the chemicals sector matrix. IFF now sits against resistance at $81, meanwhile, support can be found at $75. |
| MSFT Microsoft Corporation ($387.77) - Software - Shares of MSFT broke a double top at $384, ending its streak of two consecutive sell signals. That said, the 1 for 5'er still trades in a negative trend and lacks market relative strength, with it also ranking in the bottom quintile of the top 500 large cap matrix. The stock remains one to avoid for the time being until we see additional improvement. From here, initial resistance resistance lies at $400, with the bearish resistance lines at $424. |
| WMT Walmart Inc. ($108.29) - Retailing - WMT broke a double bottom at $112 for a second sell signal as shares fell to $108, marking their lowest level for 2026. This will also cause the stock to reverse into Os on its market RS chart, dropping the stock down to a 3 for 5'er. From here, initial support now lies at $99, while additional can be found in the low to mid $90s. |
| WOR Worthington Enterprises Inc. ($53.61) - Steel/Iron - WOR fell to a sell signal and a negative trend Wednesday when it broke a spread quadruple bottom at $52. The negative trend change will drop WOR to a weak 1 for 5'er. From here, the next level of support on the chart sits at $46. |
The option suggestions featured here are pulled from the NDW Options Ideas tool. These are just a sample of the ideas that can be found there. The Options Idea tool contains numerous additional income and speculative plays. It also offers relative strength-based screens targeting the highest (and lowest) relative strength stocks and ETFs that have recently moved counter to their longer-term trend. To access or subscribe to the Options Ideas tool, click here.
Call
Linde Plc (LIN) September 18 $530 Call

| Additional Data: | |
| Bid/Ask Spread | 16.47% |
| Delta | 57.38 |
| Gamma | 0.66 |
| Implied Volatility | 24.32% |
| Expiry Date | 78 |
| Earnings Date | 7/31/2026 |
Put
Synopsys (SNPS) September 18 $460 Put

| Additional Data: | |
| Bid/Ask Spread | 13.75% |
| Delta | -46.12 |
| Gamma | 0.38 |
| Implied Volatility | 52.15% |
| Expiry Date | 78 |
| Earnings Date | 9/08/2026 |
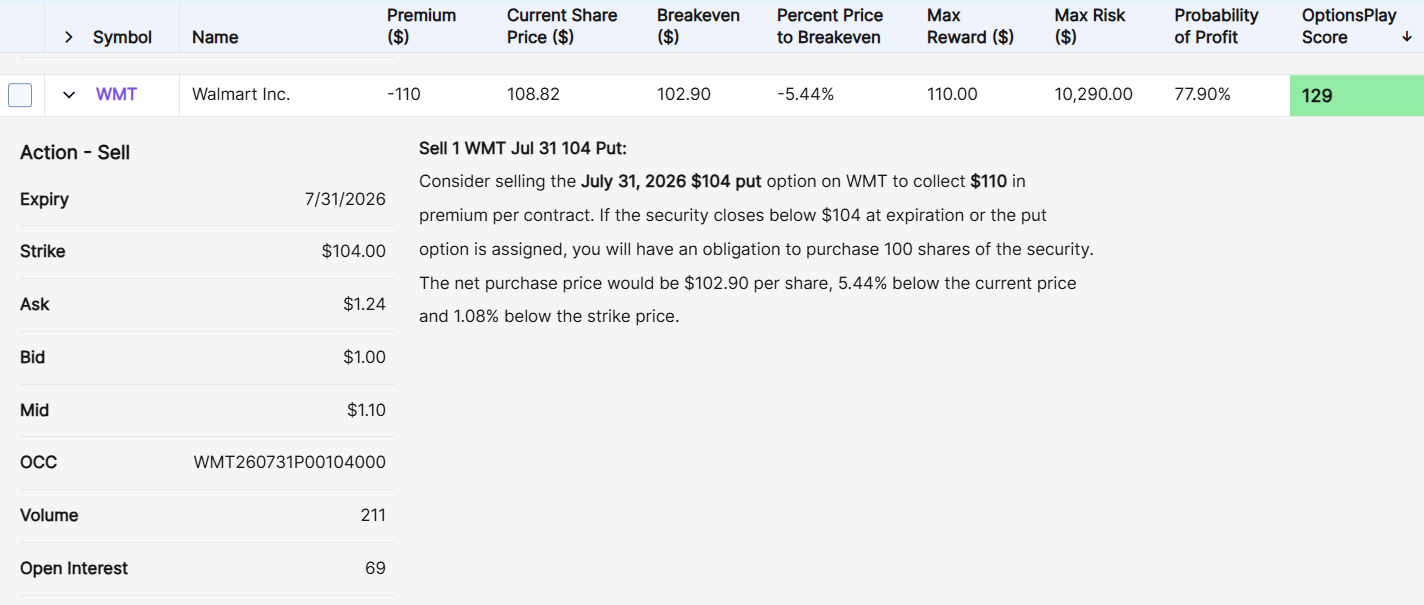
Income (Short Put)
Walmart Inc. (WMT) July 31 $104 Short Put
| Additional Data: | |
| Ann. Static Return | 14.09% |
| Bid/Ask Spread | 24.00% |
| Delta | 23.76 |
| Gamma | -3.99 |
| Implied Volatility | 24.49% |
| Expiry Date | 29 |
| Earnings Date | 8/20/2026 |
Daily Equity & Market Analysis
Loading, Please Wait...
