Most Requested Symbols

On Friday, the Bureau of Labor Statistics released the latest Consumer Price Index (CPI), which showed further cooling in inflation. What does this mean for the fixed income space?
Analyzing this week's breakouts and breakdowns within Dow-related stocks.
The curve has an average reading of 31.43%.
Weekly Rundown Video – Feb 11, 2026
Weekly rundown with NDW analyst team covering all major asset classes.
Weekly rundown with NDW analyst team covering all major asset classes.
On Friday, the Bureau of Labor Statistics (BLS) released the latest Consumer Price Index (CPI), which showed further cooling in inflation. Headline CPI came in 0.1% below expectations, at 2.4% year‑over‑year versus the 2.5% forecast. Notably, tariffs implemented during Liberation Day (April 2025) still remain within the 12‑month lookback window used in the CPI calculation. As those tariffs roll out of the dataset after May, inflation readings should continue to trend lower, removing a key upward influence on price growth.
As inflation cools, expectations for a rate cut continue to rise, reflected immediately after the softer CPI release. The chart below shows the market‑implied probability of a 25-bps rate cut at the June 17th FOMC meeting, which increased from 63% to 67% following Friday’s data. In general, these probabilities are derived by comparing the current federal funds rate to the implied rate embedded in federal funds futures pricing. (Click here to see more).

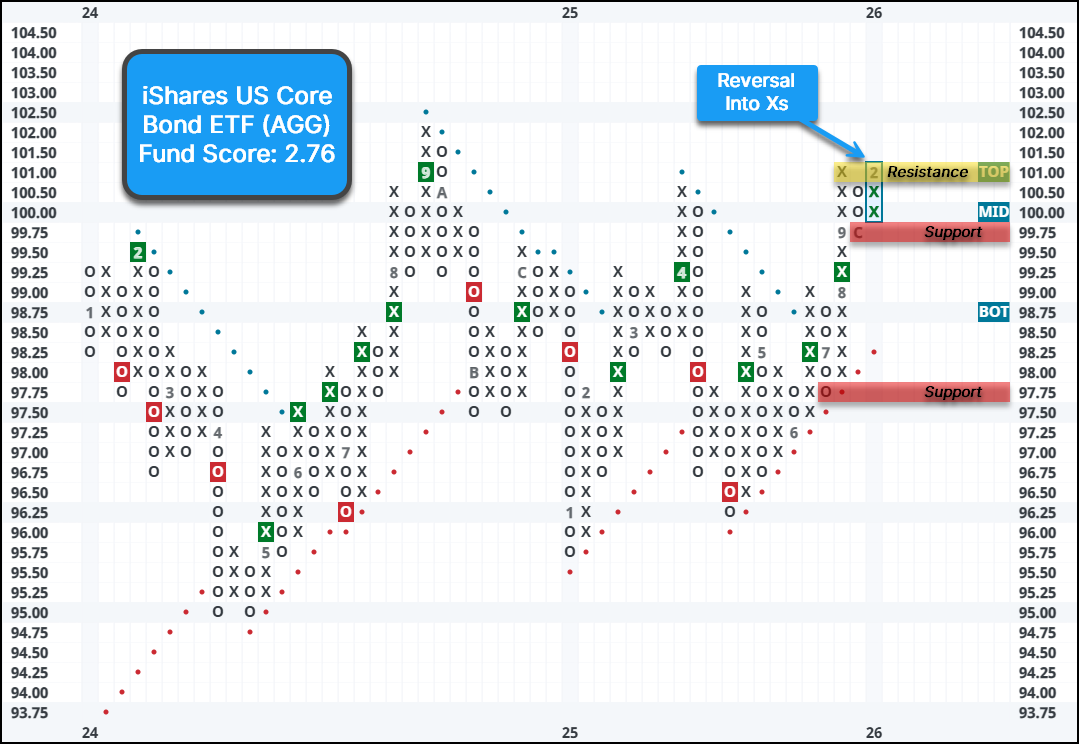
With the latest CPI print, the iShares US Core Bond (AGG), a fixed income ETF that provides exposure to corporate and government-related fixed income bonds, saw some positive movement. The fund reversed back into Xs, after reaching an intraday high above $101, and is now facing resistance at $101. The AGG has a low fund score of 2.76, but does have a positive score direction of 1.22, highlighting improvement in recent months. Support can be seen at $99.75 and $97.75.
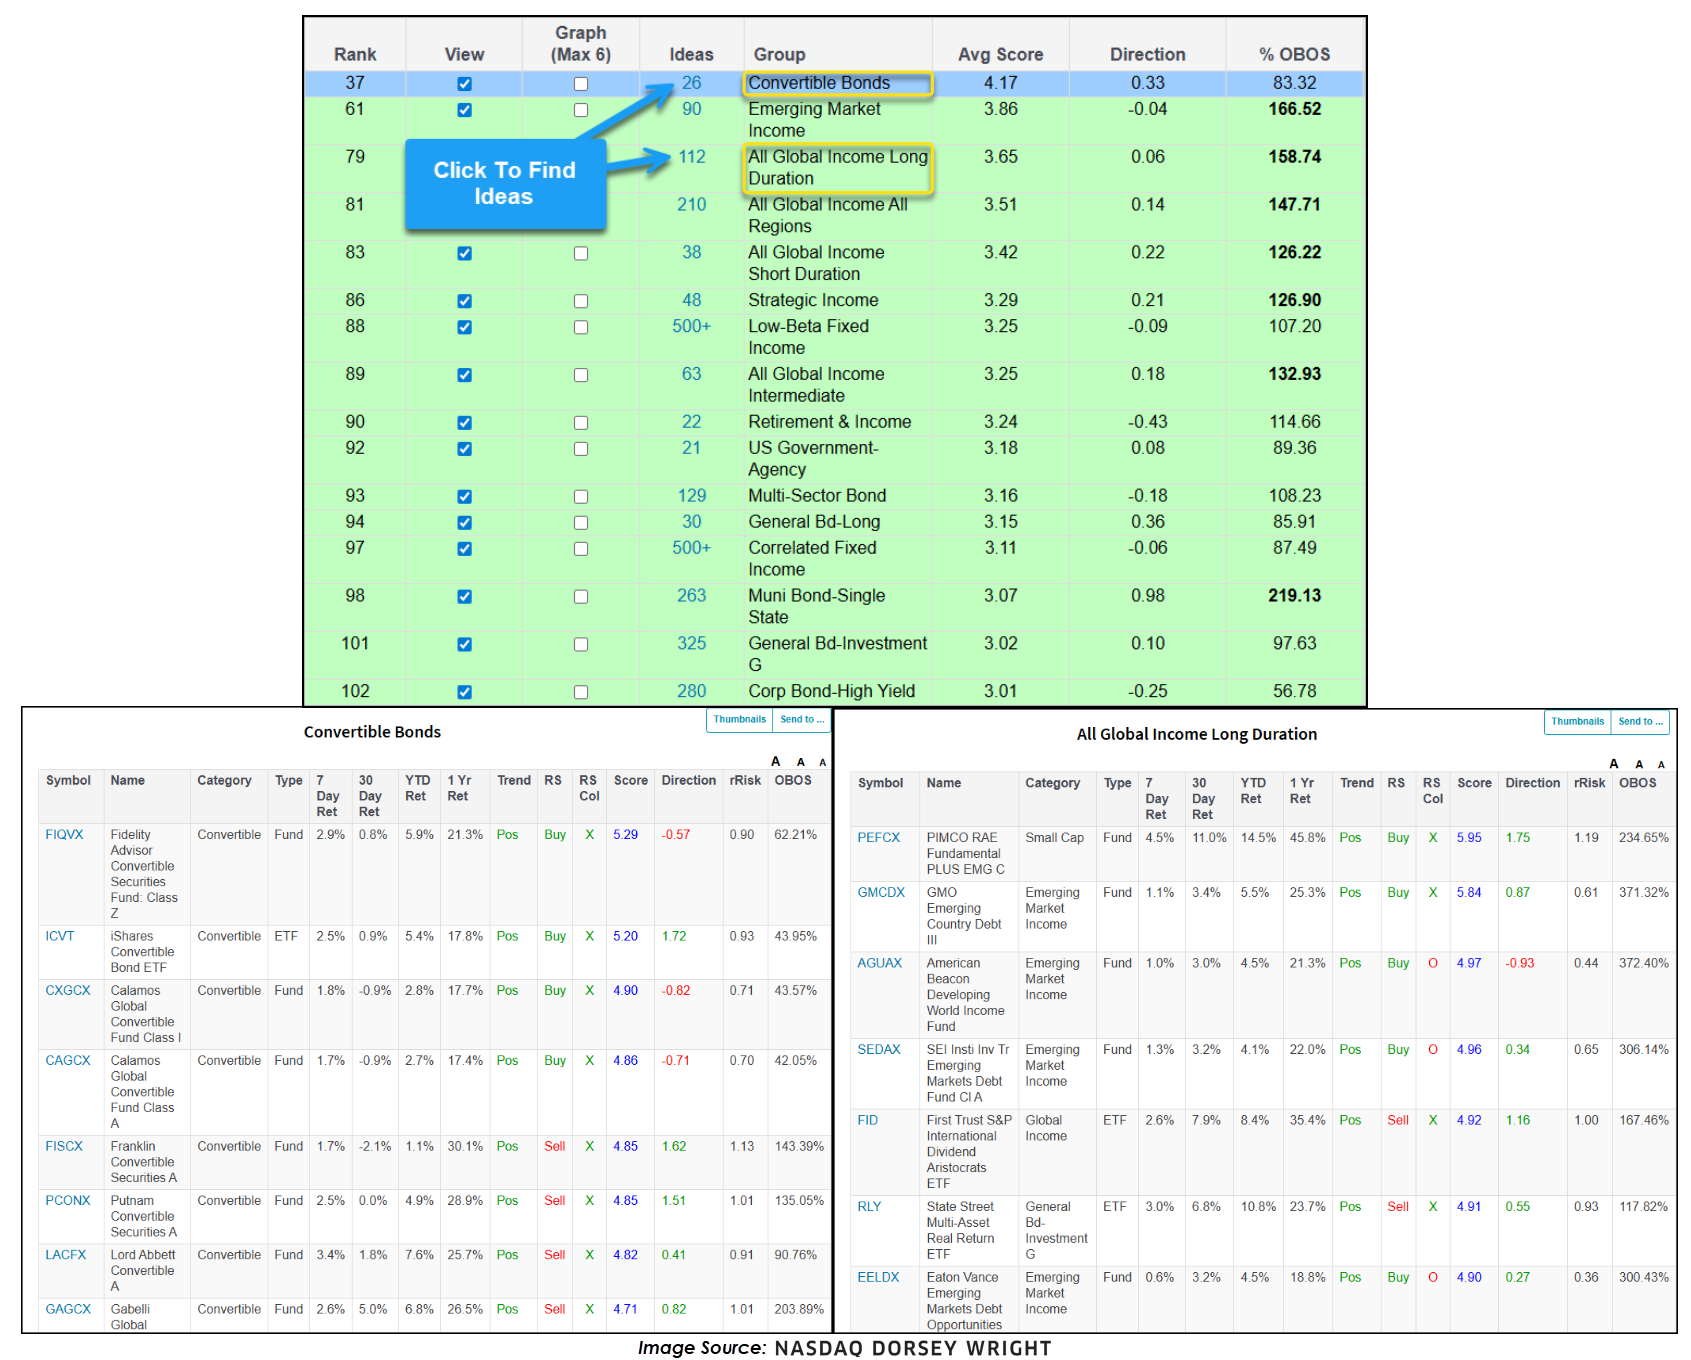
What does this mean for the fixed income space? Although fixed income groups currently rank weaker relative to equities, they remain a core component of client portfolios. The asset class group scores page serves as an effective idea‑generation tool, providing curated list of funds ranked by fund scores, under the “Ideas” tab. As expectations for further rate cuts grow, both equities and fixed income, especially longer‑duration segments, stand to benefit.
One area particularly well‑positioned is the Convertible Bonds group, which currently maintains an attractive average score of 4.17. Because convertibles blend bond and equity characteristics, they may benefit twice: from rising bond prices and from improving equity performance in a rate‑cut environment. Another group likely to see upside is All Global Income Long Duration, which holds a strong average score of 3.65. The group offers exposure to long duration bonds, meaning that these bonds are mathematically more sensitive to falling interest rates.
With inflation continuing to cool and rate‑cut expectations ticking higher, fixed income is entering a more constructive environment. As more opportunities become available, positioning yourself in areas of strength will provide a more favorable risk-reward balance as we move further into 2026.

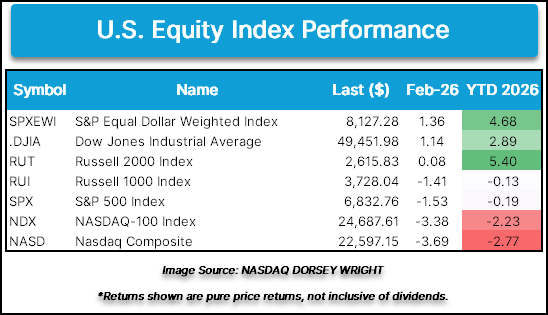
February has provided an intriguing dispersion when considering U.S. equity index performance with the Dow Jones Industrial Average (.DJIA) and S&P 500 Equal Weight (SPXEWI) up over 1%, while the Nasdaq-100 (NDX) and Nasdaq Composite (NASD) are down more than 3%. Technology’s recent descent has been a primary theme for the Nasdaq indices, but the ‘other 493’ along with some notable non-tech related mega caps have assisted the Dow and S&P 500 Equal Weight in their recent performance and rally to all-time chart highs during this week’s trading.
Among the stocks within the Dow 30 to also rally to new highs this week trading were Honeywell (HON) (on 2/10), Walmart (WMT), Caterpillar (CAT), Johnson & Johnson (JNJ), McDonald’s (MCD), and Coca-Cola (KO) (all on 2/12). While not quite reaching all-time highs, Chevron (CVX) sits within one box of the all-time chart high from November 2022. Additional positive action has been witnessed from 3M (MMM), Merck (MRK), and Verizon (VZ) reaching 52-week highs, while names like Home Depot (HD) Procter & Gamble (PG), and Sherwin-Williams (SHW) breaking past near-term resistance.
While the 13 aforementioned stocks provided positive contribution to the Dow index, there were a handful of notable breakdowns. Likely the two most noteworthy breaks came from Amazon (AMZN) and International Business Machine (IBM) as technical deterioration accompanied their moves lower.
Amazon (AMZN) kicked off the month of February reversing lower before earnings last week brought the stock back to a sell signal, ending a series of buy signals that began back in April 2025 as shares fell to just above $200. The magnitude of the post-earnings move brought the market RS chart against the S&P 500 Equal Weight Index (SPXEWI) back to a column of Os and to an RS sell signal after having been on a market RS buy signal since September 2023. This week’s action witnessed shares dip below $198 on the point and figure chart, violating the bullish support line and dropping the stock to a 1 for 5’er in technical attribute rating. This brings the stock to its lowest technical attribute rating since early 2023 and the default chart its lowest level since May 2025. While support resides at current chart levels, additional can be found in the mid to low $180s and mid to lower $160s.
IBM’s February action kicked off with a return to a sell signal and violation of the bullish support line, dropping the stock down to a 3 for 5’er before capping off last week’s action trading back to the middle of the 10-week moving average. This week’s action brought about a reversal into Os and a violation of additional support as shares fell to $260. With this move, the market RS chart against the S&P 500 Equal Weight Index reversed into Os after having been in Xs since October 2025. This brought IBM down to a 2 for 5’er for the first time since late 2023. From here, initial support for the stock now lies at $236, while additional can be found in the mid to upper $220 range.

Although not quite experiencing the same level of technical attribute deterioration, higher attribute names like American Express (AXP), Cisco (CSCO), and Disney (DIS) witnessed breakdowns during this week’s trading.
After rallying to highs in December and early January, American Express (AXP) returned to a sell signal in mid-January. This week’s action brought a third sell signal with the completion of a bearish catapult as shares fell to $340. The stock continues to maintain a 5 technical attribute rating, which has been sustained since January 2024, but this break brings the market RS chart against the S&P 500 Equal Weight Index within one box of reversing into Os. From here, support for the stock now lies at $336, while additional can be found in the $316 to $320 range.
Cisco (CSCO) capped off last week’s action on a positive one with a peer RS buy signal against the NDW Computer Index (DWACOMP), increasing the stock to a 5 technical attribute stock for the first time since 2020. This week’s action started positively with a rally to a new all-time chart high at $88 during Tuesday’s (2/10) trading. Although the company beat on most earnings metrics Thursday (2/12), a conservative outlook and scrutiny over margins brought downside action after reporting earnings. The default point and figure chart returned to a sell signal after breaking a double bottom at $80 as shares fell to $75. From here, initial support now lies at $73, while the bullish support line sits at $71.
Disney’s (DIS) initial sell signal came in October last year following a fifth rally to resistance in the $120s in June that was rejected. Fast-forward to this week’s action and Thursday’s (2/12) reversal into Os led to a third sell signal and drop to the lowest level since November at $102. From here, support lies at current chart levels, while the bullish support line resides at $94.
As for the remainder of the Dow 30 stocks, names like Salesforce (CRM), UnitedHealth (UNH), and Microsoft (MSFT) have seen rebounds off recent lows, while Amgen (AMGN) and Traveler’s Insurance (TRV) have pulled back from recent highs. Notable Mag 7 stocks, Apple (AAPL) and NVIDIA (NVDA) have consolidated this week along with J.P. Morgan (JPM), Goldman Sach (GS), and Boeing (BA). Meanwhile, Visa (V) and Nike (NKE) joined the crowd of stocks falling back to Os after brief reversals into Xs.


| Symbol | Name | Price | Yield | PnF Trend | RS Signal | RS Col. | Fund Score | 200 Day MA | Weekly Mom |
|---|---|---|---|---|---|---|---|---|---|
| DIA | SPDR Dow Jones Industrial Average ETF Trust | 494.67 | 1.41 | Positive | Sell | X | 4.11 | 457.92 | - 1W |
| EEM | iShares MSCI Emerging Markets ETF | 60.86 | 2.05 | Positive | Buy | X | 5.54 | 51.94 | + 7W |
| EFA | iShares MSCI EAFE ETF | 104.15 | 3.22 | Positive | Sell | X | 4.53 | 92.87 | + 8W |
| IJH | iShares S&P MidCap 400 Index Fund | 70.54 | 1.30 | Positive | Buy | O | 4.29 | 64.58 | + 11W |
| IJR | iShares S&P SmallCap 600 Index Fund | 129.40 | 1.36 | Positive | Sell | O | 3.26 | 116.40 | + 11W |
| QQQ | Invesco QQQ Trust | 600.64 | 0.45 | Positive | Buy | O | 3.92 | 580.62 | - 7W |
| RSP | Invesco S&P 500 Equal Weight ETF | 200.79 | 1.58 | Positive | Sell | O | 3.20 | 187.14 | + 11W |
| SPY | State Street SPDR S&P 500 ETF Trust | 681.27 | 1.05 | Positive | Buy | X | 4.69 | 648.02 | - 7W |
| XLG | Invesco S&P 500 Top 50 ETF | 57.24 | 0.64 | Positive | Buy | X | 4.56 | 55.40 | - 7W |

Average Level
31.43
| < - -100 | -100 - -80 | -80 - -60 | -60 - -40 | -40 - -20 | -20 - 0 | 0 - 20 | 20 - 40 | 40 - 60 | 60 - 80 | 80 - 100 | 100 - > |
|---|---|---|---|---|---|---|---|---|---|---|---|
|
Sell signalief
|
|||||||||||
|
Buy signalijr
|
|||||||||||
|
Buy signalfxe
|
|||||||||||
|
Buy signaltlt
|
|||||||||||
|
Buy signalVOOV
|
|||||||||||
|
Buy signalgsg
|
|||||||||||
|
Buy signalXLG
|
Buy signaluso
|
||||||||||
|
Sell signaldx/y
|
Buy signalIJH
|
Buy signalicf
|
|||||||||
|
Sell signalONEQ
|
Buy signalshy
|
Buy signalagg
|
Buy signalEEM
|
||||||||
|
Sell signalVOOG
|
Buy signalSPY
|
Buy signalhyg
|
Buy signaldia
|
Buy signalrsp
|
Buy signaldvy
|
||||||
|
Buy signalQQQ
|
Buy signalgcc
|
Buy signaliwm
|
Sell signallqd
|
Buy signalGLD
|
Buy signalefa
|
||||||
| < - -100 | -100 - -80 | -80 - -60 | -60 - -40 | -40 - -20 | -20 - 0 | 0 - 20 | 20 - 40 | 40 - 60 | 60 - 80 | 80 - 100 | 100 - > |
| AGG | iShares US Core Bond ETF |
| USO | United States Oil Fund |
| DIA | SPDR Dow Jones Industrial Average ETF |
| DVY | iShares Dow Jones Select Dividend Index ETF |
| DX/Y | NYCE U.S.Dollar Index Spot |
| EFA | iShares MSCI EAFE ETF |
| FXE | Invesco CurrencyShares Euro Trust |
| GLD | SPDR Gold Trust |
| GSG | iShares S&P GSCI Commodity-Indexed Trust |
| HYG | iShares iBoxx $ High Yield Corporate Bond ETF |
| ICF | iShares Cohen & Steers Realty ETF |
| IEF | iShares Barclays 7-10 Yr. Tres. Bond ETF |
| LQD | iShares iBoxx $ Investment Grade Corp. Bond ETF |
| IJH | iShares S&P 400 MidCap Index Fund |
| ONEQ | Fidelity Nasdaq Composite Index Track |
| QQQ | Invesco QQQ Trust |
| RSP | Invesco S&P 500 Equal Weight ETF |
| IWM | iShares Russell 2000 Index ETF |
| SHY | iShares Barclays 1-3 Year Tres. Bond ETF |
| IJR | iShares S&P 600 SmallCap Index Fund |
| SPY | SPDR S&P 500 Index ETF Trust |
| TLT | iShares Barclays 20+ Year Treasury Bond ETF |
| GCC | WisdomTree Continuous Commodity Index Fund |
| VOOG | Vanguard S&P 500 Growth ETF |
| VOOV | Vanguard S&P 500 Value ETF |
| EEM | iShares MSCI Emerging Markets ETF |
| XLG | Invesco S&P 500 Top 50 ETF |
| Symbol | Company | Sector | Current Price | Action Price | Target | Stop | Notes |
|---|---|---|---|---|---|---|---|
| JPM | J.P. Morgan Chase & Co. | Banks | $302.64 | lo 300s - mid 320s | 380 | 256 | 5 TA rating, top 25% of favored BANK sector matrix, LT RS buy, LT pos trend, buy-on-pullback |
| EWBC | East West Bancorp, Inc. | Banks | $117.24 | mid 100s - mid 110s | 157 | 92 | 4 for 5'er, top third of favored BANK sector matrix, LT pos peer RS, one box from mkt RS buy, spread quad top |
| ULTA | Ulta Beauty, Inc. | Retailing | $667.18 | 632 - hi 600s | 840 | 568 | 4 TA rating, top 10% of RETA sector matrix, LT RS buy, consec buy signals |
| APTV | Aptiv PLC | Autos and Parts | $83.00 | hi 70s - low 80s | 100 | 69 | 5 for 5'er, top half of AUTO sector matrix, successful trend line test |
| GS | Goldman Sachs Group, Inc. | Wall Street | $904.55 | mid-800s - mid-900s | 1416 | 736 | 5 TA rating, top 10% of WALL sector matrix, LT RS buy, LT pos trend, buy-on-pullback |
| PHM | PulteGroup, Inc. | Building | $138.89 | hi 120s - mid 130s | 168 | 110 | 4 for 5'er, top half of BUIL sector matrix, LT pos peer & mkt RS, bullish catapult |
| ATO | Atmos Energy Corp | Gas Utilities | $177.77 | 170s | 202 | 148 | 4 for 5'er. top 20% of GUTI sector matrix, LT pos peer RS, 3.3% yield |
| CBOE | CBOE Global Markets Inc. | Wall Street | $270.60 | lo 260s - mid 280s | 332 | 228 | 5 TA rating, top 25% of WALL sector matrix, LT RS buy, LT pos trend, buy-on-pullback |
| DAL | Delta Air Lines Inc. | Aerospace Airline | $69.50 | mid-to-hi 60s | 99 | 55 | 4 for 5'er, top half of AERO sector matrix, LT pos mkt RS, triple top, buy on pullback |
| Symbol | Company | Sector | Current Price | Action Price | Target | Stop | Notes |
|---|
| Symbol | Company | Sector | Current Price | Action Price | Target | Stop | Notes |
|---|---|---|---|---|---|---|---|
| META | Meta Platform Inc. | Internet | $649.81 | 650s - 690s | 1040 | 552 | META has fallen to a sell signal. OK to hold here. Maintain $552 stop. |
| Comment | |||||||
|---|---|---|---|---|---|---|---|
|
|
|||||||
DAL Delta Air Lines Inc. R ($69.35) - Aerospace Airline - DAL is a 4 for 5'er that ranks in the top half of the favored aerospace/airline sector matrix and has been in a market RS buy signal since 2023. After giving three consecutive sell signals, DAL rallied and returned to a buy signal with a triple top break at $72 in last week's trading and continued higher, notching a new all-time high at $76. DAL has subsequently pulled back to below the middle of its trading band, offering an entry point for long exposure. Positions may be added in the mid-to-upper $60s and we will set our initial stop at $55, a potential spread quadruple bottom break on DAL's default chart. We will use the bullish price objective, $99, as our target price. giving us a reward-to-risk ratio north of 2.0. DAL also carries a 1% yield.
| 26 | |||||||||||||||||||||||||||||
| 76.00 | X | 76.00 | |||||||||||||||||||||||||||
| 75.00 | X | O | 75.00 | ||||||||||||||||||||||||||
| 74.00 | X | O | 74.00 | ||||||||||||||||||||||||||
| 73.00 | X | X | O | 73.00 | |||||||||||||||||||||||||
| 72.00 | X | 1 | O | X | O | 72.00 | |||||||||||||||||||||||
| 71.00 | X | O | X | O | X | X | X | O | 71.00 | ||||||||||||||||||||
| 70.00 | X | O | X | O | X | O | X | O | X | O | 70.00 | ||||||||||||||||||
| 69.00 | X | O | O | X | O | X | O | X | O | Mid | 69.00 | ||||||||||||||||||
| 68.00 | X | O | O | X | O | 2 | O | 68.00 | |||||||||||||||||||||
| 67.00 | X | O | O | X | 67.00 | ||||||||||||||||||||||||
| 66.00 | X | O | X | 66.00 | |||||||||||||||||||||||||
| 65.00 | C | O | • | 65.00 | |||||||||||||||||||||||||
| 64.00 | X | • | 64.00 | ||||||||||||||||||||||||||
| 63.00 | 9 | X | • | 63.00 | |||||||||||||||||||||||||
| 62.00 | X | O | X | X | X | • | 62.00 | ||||||||||||||||||||||
| 61.00 | X | X | O | X | O | X | O | X | X | • | 61.00 | ||||||||||||||||||
| 60.00 | X | O | X | O | X | O | X | O | X | O | X | • | 60.00 | ||||||||||||||||
| 59.00 | X | O | X | O | A | O | X | O | X | O | X | • | 59.00 | ||||||||||||||||
| 58.00 | X | X | O | O | X | O | O | X | O | X | • | Bot | 58.00 | ||||||||||||||||
| 57.00 | X | O | X | O | X | O | X | O | X | • | 57.00 | ||||||||||||||||||
| 56.00 | X | O | X | O | B | • | O | • | 56.00 | ||||||||||||||||||||
| 55.00 | X | O | X | • | • | 55.00 | |||||||||||||||||||||||
| 54.00 | X | O | X | • | 54.00 | ||||||||||||||||||||||||
| 53.00 | X | O | X | • | 53.00 | ||||||||||||||||||||||||
| 52.00 | X | X | 8 | X | • | 52.00 | |||||||||||||||||||||||
| 51.00 | 6 | O | 7 | O | • | 51.00 | |||||||||||||||||||||||
| 50.00 | X | O | X | • | 50.00 | ||||||||||||||||||||||||
| 49.00 | X | O | X | X | • | 49.00 | |||||||||||||||||||||||
| 48.00 | X | O | X | O | X | • | 48.00 | ||||||||||||||||||||||
| 47.00 | O | X | O | X | • | 47.00 | |||||||||||||||||||||||
| 46.00 | O | O | • | 46.00 | |||||||||||||||||||||||||
| 26 |

| ABBV AbbVie Inc. ($232.00) - Drugs - ABBV reversed back into a buy signal after completing a double top break at $322. The 5 for 5'er has been on a market RS buy signal since 2022, highlighting its long-term strength. Additionally, the stock offers a strong yield of 3%. Long exposure can be made here. Initial support is at $208, with additional support at $190. |
| AMAT Applied Materials, Inc. ($354.91) - Semiconductors - AMAT moved higher Friday after the company's earnings release, breaking a triple top at $348 before reaching a new all-time high at $376 intraday. This 5 for 5'er moved to a positive trend in September and has maintained an RS buy signal against the market since 2023. The weight of the technical evidence is favorable, however, AMAT is in overbought territory. Initial support can be seen at $328. |
| BABA Alibaba Group Holding Ltd (China) ADR ($154.85) - Retailing - BABA broke a double bottom at $156 for a second sell signal as shares fell to $154. The move violates the bullish support line, which will drop the stock down to a 2 for 5'er. From here, support now lies at $146, the January chart low. |
| C Citigroup, Inc. ($110.42) - Banks - C shares moved lower today to break a double bottom at $110 to mark its first sell signal. This 5 for 5'er has been in a positive trend since May 2025 and on an RS buy signal versus the market since January 2025. C shares are trading below the middle of their ten-week trading band with a weekly overbought/oversold reading of -27%. From here, support is offered at $96. |
| CMC Commercial Metals Corporation ($79.64) - Steel/Iron - After giving four consecutive buy signals CMC broke a double bottom at $79. The outlook for CMC remains positive as the stock is a 4 for 5'er and ranks fourth out of 14 names in the favored steel/iron sector matrix, From here, a reversal into Xs would put CMC into the action phase of a potential shakeout pattern; however, a move to $74 would take out another level of support on CMC's chart and negate the potential for a shakeout. |
| DKS Dick's Sporting Goods, Inc. ($201.61) - Retailing - DKS broke a double bottom at $198 for a third sell signal and to violate the bullish support line. This will drop the stock down to a 2 for 5'er trading in a negative trend, and the stock has fallen into the bottom quartile of the Retailing sector matrix. Support lies at current chart levels, while the next level of support lies aroudn $170. |
| LIN Linde Plc ($481.56) - Chemicals - LIN returned to a buy signal and a positive trend Friday when it broke a spread triple top at $488, taking our resistance that had been in place since September 2024. The positive trend change will promote LIN to an acceptable 3 for 5'er. From here, the first level of support sits at $448. |
| STLD Steel Dynamics Inc. ($191.61) - Steel/Iron - STLD gave an initial sell signal Friday when it broke a double bottom at $190 and continued lower to $186. The outlook for the stock remains positive, however, as STLD Is a 5 for 5'er and ranks in the top half of the favored steel/iron sector matrix. From here, the next level of support is STLD's bullish support line at $176. |
| V Visa Inc. ($314.73) - Finance - V shares moved lower today to break a double bottom and mark its second consecutive sell signal. This 3 for 5'er has been in a negative trend since January but on an RS buy signal versus the market since November 2012. V shares are trading below the middle of their ten-week trading band with a weekly overbought/oversold reading of -46%. From here, support is offered at $316 and $300. |
| Name | Option Symbol | Action | Stop Loss |
|---|---|---|---|
| AFLAC Incorporated - $114.85 | O: 26B115.00D20 | Buy the February 115.00 calls at 4.90 | 106.00 |
| Name | Option | Action |
|---|---|---|
| NVIDIA Corporation ( NVDA) | Mar. 180.00 Calls | Stopped at 16.05 (CP: 12.60) |
| Aptiv PLC ( APTV) | May. 82.50 Calls | Initiate an option stop loss of 6.20 (CP: 8.20) |
| Name | Option Symbol | Action | Stop Loss |
|---|---|---|---|
| Datadog Inc Class A - $124.93 | O: 26P125.00D17 | Buy the April 125.00 puts at 10.65 | 134.00 |
| Name | Option | Action |
|---|---|---|
| Caesars Entertainment Inc. ( CZR) | Mar. 22.00 Puts | Initiate an option stop loss of 1.95 (CP: 3.95) |
| Constellation Brands, Inc. ( STZ) | Apr. 155.00 Puts | Initiate an option stop loss of 8.10 (CP: 10.10) |
| Name | Option Sym. | Call to Sell | Call Price | Investment for 500 Shares | Annual Called Rtn. | Annual Static Rtn. | Downside Protection |
|---|---|---|---|---|---|---|---|
| Delta Air Lines Inc. $ 69.50 | O: 26D70.00D17 | Apr. 70.00 | 4.45 | $ 32,692.75 | 34.77% | 32.91% | 5.38% |
| Name | Action |
|---|---|
| Alcoa Inc. ( AA) - 60.51 | Sell the March 60.00 Calls. |
| Intel Corporation ( INTC) - 46.48 | Sell the May 49.00 Calls. |
| The Gap, Inc. ( GAP) - 27.19 | Sell the March 29.00 Calls. |
| Fortinet Inc. ( FTNT) - 84.26 | Sell the May 90.00 Calls. |
| Enphase Energy Inc ( ENPH) - 44.14 | Sell the April 50.00 Calls. |
| Target Corporation ( TGT) - 112.69 | Sell the May 115.00 Calls. |
| Name | Covered Write |
|---|---|
| Dollar General Corp. ( DG - 148.56 ) | May 150.00 covered write. |
Daily Equity & Market Analysis
LISTEN TO PODCAST
Feb 12, 2026
NDW MORNING UPDATE
Feb 13, 2026
Loading, Please Wait...
