There are no changes to any of the Invesco models this week. As we do each quarter, today we will review the performance of the models covered in this report.
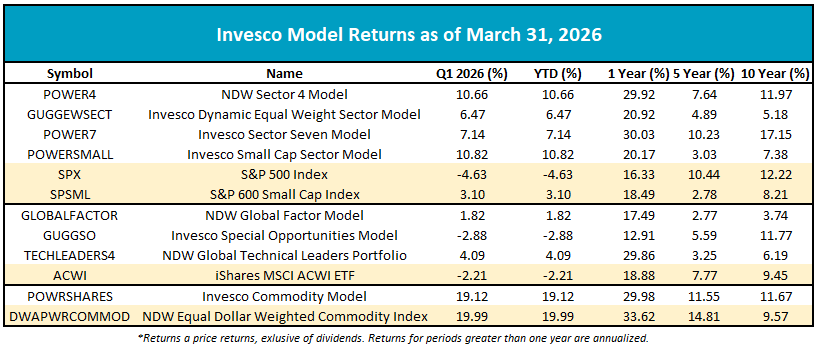
There are no changes to any of the Invesco models this week. As we do each quarter, today we will review the performance of the models covered in this report. It was a rough quarter for US equities as worries about AI and the war in Iran led the S&P 500 to decline more than 4.5%. The NDW Sector 4 Model (POWER4), Invesco Dynamic Equal Weight Sector Model (GUGGEWSECT), and Invesco Sector Seven Model (POWER7) all outperformed S&P 500 by more than 10% for the quarter, aided by exposure to the energy sector. Small cap stocks fared better than their large cap counterparts as the S&P 600 Small Cap Index finished the quarter with a gain of 3.1%. The Invesco Small Cap Sector Model (POWERSMALL) outpaced the benchmark, advancing a bit under 11%. Like the large cap models, POWERSMALL also benefited from energy exposure.
International equities struggled toward the end of the quarter as a rising US dollar acted as a headwind and the benchmark iShares MSCI ACWI ETF (ACWI) finished the quarter down -2.21%. The NDW Global Factor (GLOBALFACTOR) and NDW Global Technical Leaders Portfolio (TECHLEADERS4) both finished the quarter in positive territory, however.
It was a rocky road for commodities in Q1 as precious metals experienced sharp declines from the highs they reached earlier the year, meanwhile, the conflict in the Middle East spurred a gain of more than 75% for crude oil. The Invesco Commodity Model (POWRSHARES) finished the quarter up just over 19% but trailed the benchmark which gained 19.99%.