Most Requested Symbols

There are changes to four Invesco models this week, the DWA Global Factor Model GLOBALFACTOR, Invesco Small Cap Sector Model POWERSMALL, the DWA Sector Four Model POWER4, and the Invesco Dynamic Equal Weight Sector Model GUGGEWSECT.
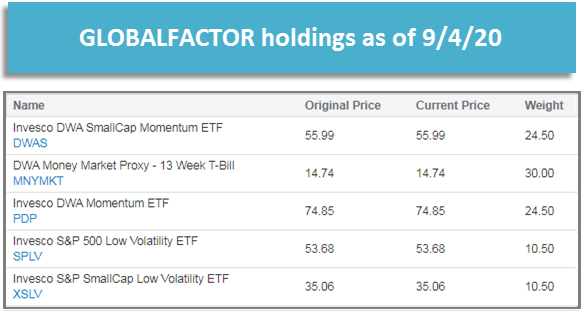
GLOBALFACTOR added the Invesco DWA Momentum ETF PDP, Invesco DWA Smallcap Momentum ETF DWAS, Invesco S&P 500 Low Volatility ETF SPLV, and the Invesco S&P Smallcap Low Volatility ETF XSLV. Prior to this change the model portfolio had been 100% cash because both domestic equities and international equities were ranked below cash in the DALI asset class rankings. Since the last model evaluation, domestic equities has overtaken cash and fixed income to retake the top spot in the rankings and therefore the model has once again added exposure to domestic equities. The momentum funds – PDP and DWAS – are overweight relative to the low volatility funds because domestic equities ranks number one in the DALI rankings. If domestic equities were ranked third or lower, the low volatility funds would instead have the higher allocation. The model currently retained a 30% allocation to cash because international equities remain below cash in the DALI asset class rankings.
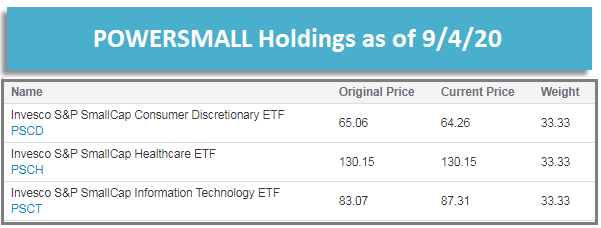
POWERSMALL removed the Invesco S&P Smallcap Energy ETF PSCE and added the Invesco S&P Smallcap Healthcare ETF PSCH. PSCE was removed because its rank in the model’s relative strength matrix fellow below the threshold to remain a holding in the portfolio. In place of PSCE, the model added PSCH as it was the highest-ranking fund in the matrix that was not already a holding in the portfolio. The full model holdings are displayed below.
POWER4 removed the Invesco DWA Healthcare Momentum ETF PTH and added the Invesco DWA Industrials Momentum ETF PRN. PTH was removed because healthcare fell out of the top four in the model’s sector rankings. In place of PTH, the model added PRN because industrials moved into the top four sectors in the rankings. The model now has exposure to consumer cyclicals, industrials, energy, and technology.
GUGGEWSECT removed the Invesco S&P Equal Weight Energy ETF RYE and added the Invesco S&P Equal Weight Health Care ETF RYH. RYE was removed because energy fell out of the top three in the model’s sector rankings. In place of RYE, the model added RYH as healthcare is now the third-ranked sector in model rankings. The model now has exposure to consumer cyclicals, technology, and healthcare.

The distribution curve places each ETF on a bell curve according to their respective degrees of overbought or oversold status using a 10-week distribution. ETFs that are statistically oversold will appear on the left-hand side of the bell curve, while those that have become statistically overbought will appear on the right-hand side of the bell curve. Perhaps the most useful attribute of this feature is that it displays the entire universe on the curve at one time to give us a general picture of whether the Invesco ETF universe is generally overbought on a near-term basis, or generally oversold. Our best opportunities are to buy strong relative strength ETFs that have regressed back toward mean conditions based on market weakness, or have become oversold based upon extreme market weakness. Weekly Distribution is a short-term gauge that is most helpful in timing entry and exit points, while the longer-term information of trend and relative strength is a more controlling factor in the decision of whether to buy or sell.
Average Level
24.44
| <--100 | -100--80 | -80--60 | -60--40 | -40--20 | -20-0 | 0-20 | 20-40 | 40-60 | 60-80 | 80-100 | 100-> | |||
 |
||||||||||||||
Legend:
| Ticker | Name | Buys | Xs | Tech Attribute/ Score |
|---|---|---|---|---|
| QQQ | Invesco QQQ Trust | 15 | 14 | 5.91 |
| PWB | Invesco Dynamic Large Growth | 13 | 13 | 5.66 |
| PDP | Invesco DWA Momentum ETF | 11 | 11 | 5.56 |
| XMMO | Invesco S&P MidCap Momentum ETF | 11 | 11 | 5.20 |
| XMHQ | Invesco S&P MidCap Quality ETF | 10 | 10 | 4.35 |
| XSMO | Invesco S&P SmallCap Momentum ETF | 9 | 10 | 5.12 |
| PFM | Invesco Dividend Achievers ETF | 9 | 5 | 4.13 |
| PKW | Invesco Buyback Achievers ETF | 8 | 3 | 4.80 |
| PRFZ | Invesco FTSE RAFI US 1500 Small-Mid ETF | 7 | 8 | 2.91 |
| PWC | Invesco Dynamic Market ETF | 6 | 6 | 3.16 |
| PRF | Invesco FTSE RAFI US 1000 ETF | 6 | 3 | 3.01 |
| XSVM | Invesco S&P SmallCap Value with Momentum ETF | 5 | 11 | 3.55 |
| XMVM | Invesco S&P MidCap Value with Momentum ETF | 4 | 7 | 2.25 |
| DBC | Invesco DB Commodity Index Tracking | 3 | 7 | 3.08 |
| PBP | Invesco S&P 500 BuyWrite | 1 | 2 | 2.72 |
| PEY | Invesco High Yield Equity Dividend Achievers ETF | 1 | 0 | 1.95 |
| Market | Sector | International | Dynamic Sector | Commodity |

| ETF Name | Symbol | DWA Suggested Weighting | Yield | Date Added |
|---|---|---|---|---|
| Invesco Wilderhill Clean Energy | PBW | 14.286% | 0.9360 | 04/18/2019 |
| Invesco Dynamic Semiconductors ETF | PSI | 14.286% | 0.4210 | 12/27/2019 |
| Invesco Dynamic Software ETF | PSJ | 14.286% | 0.0890 | 10/09/2015 |
| Invesco Dynamic Building & Construction Port | PKB | 14.286% | 0.3830 | 06/26/2020 |
| Invesco DWA Healthcare Momentum ETF | PTH | 14.286% | 0.0000 | 01/31/2020 |
| Invesco DWA Technology Momentum ETF | PTF | 14.286% | 0.0000 | 04/18/2019 |
| Invesco Nasdaq Internet ETF | PNQI | 14.286% | 0.0000 | 03/27/2020 |
* - Dates prior to 1/24/2011, which is when the Invesco Sector Seven ETF Model Portfolio became available in the Invesco Weekly ETF Report, are representative of when the position was added to the backtested model.
| ETF Name | Symbol | DWA Suggested Weighting | Yield | Date Added |
|---|---|---|---|---|
| Invesco S&P SmallCap Consumer Discretionary ETF | PSCD | 33.333% | 1.0084 | 08/14/2020 |
| Invesco S&P SmallCap Healthcare ETF | PSCH | 33.333% | 0.0000 | 09/04/2020 |
| Invesco S&P SmallCap Information Technology ETF | PSCT | 33.333% | 0.1394 | 03/01/2019 |
* - Dates prior to 6/1/10, which is when the Invesco Small Cap Sector Model ETF Portfolio became available in the Invesco Weekly ETF Report, are representative of when the position was added to the backtested model.
| ETF Name | Symbol | DWA Suggested Weighting | Yield | Date Added |
|---|---|---|---|---|
| Invesco DWA SmallCap Momentum ETF | DWAS | 16.667% | 0.3115 | 08/07/2020 |
| Invesco DWA Momentum ETF | PDP | 50.000% | 0.2698 | 01/15/2016 |
| Invesco DWA Emerging Markets Momentum ETF | PIE | 16.667% | 1.6661 | 08/07/2020 |
| Invesco DWA Developed Markets Momentum ETF | PIZ | 16.667% | 1.1081 | 08/07/2020 |
* - Dates prior to 6/7/13, which is when the DWA Global Technical Leaders Portfolio became available in the Invesco Weekly ETF Report, are representative of when the position was added to the backtested model.
| ETF Name | Symbol | DWA Suggested Weighting | Yield | Date Added |
|---|---|---|---|---|
| Invesco DWA Consumer Cyclicals Momentum ETF | PEZ | 25.000% | 0.2220 | 05/29/2020 |
| Invesco DWA Industrials Momentum ETF | PRN | 25.000% | 0.4138 | 09/04/2020 |
| Invesco DWA Energy Momentum ETF | PXI | 25.000% | 4.2432 | 05/01/2020 |
| Invesco DWA Technology Momentum ETF | PTF | 25.000% | 0.0000 | 05/01/2020 |
| ETF Name | Symbol | DWA Suggested Weighting | Yield | Date Added |
|---|---|---|---|---|
| Invesco DWA SmallCap Momentum ETF | DWAS | 20.000% | 0.3115 | 09/04/2020 |
| DWA Money Market Proxy - 13 Week T-Bill | MNYMKT | 30.000% | 0.0000 | 09/04/2020 |
| Invesco DWA Momentum ETF | PDP | 20.000% | 0.2698 | 09/04/2020 |
| Invesco S&P 500 Low Volatility ETF | SPLV | 20.000% | 2.2720 | 09/04/2020 |
| Invesco S&P SmallCap Low Volatility ETF | XSLV | 20.000% | 3.8750 | 09/04/2020 |
* - Dates prior to 8/31/15, which is when the Invesco Multi Factor Global Equity Model became available in the Invesco Weekly ETF Report, are representative of when the position was added to the backtested model.
| ETF Name | Symbol | DWA Suggested Weighting | Yield | Date Added |
|---|---|---|---|---|
| Invesco DB Precious Metals Fund | DBP | 50.000% | 0.9660 | 12/21/2018 |
| Invesco DB Gold Fund | DGL | 50.000% | 1.5140 | 07/12/2019 |
| ETF Name | Symbol | DWA Suggested Weighting | Yield | Date Added |
|---|---|---|---|---|
| Invesco S&P Global Water Index Fund | CGW | 20.000% | 1.4860 | 08/14/2020 |
| Invesco China Technology ETF | CQQQ | 20.000% | 0.0080 | 07/10/2020 |
| Invesco Buyback Achievers ETF | PKW | 20.000% | 1.8077 | 06/12/2020 |
| Invesco S&P 500 Top 50 ETF | XLG | 20.000% | 1.3510 | 08/15/2016 |
| Invesco Solar ETF | TAN | 20.000% | 0.1760 | 05/29/2020 |
* - Dates prior to 10/14/08, which is when the Invesco Special Opportunities Model ETF Portfolio became available in the Invesco Weekly ETF Report, are representative of when the position was added to the backtested model.
| ETF Name | Symbol | DWA Suggested Weighting | Yield | Date Added |
|---|---|---|---|---|
| Invesco S&P Equal Weight Consumer Discretionary ETF | RCD | 33.333% | 1.6430 | 05/29/2020 |
| Invesco S&P Equal Weight Health Care ETF | RYH | 33.333% | 0.5900 | 09/04/2020 |
| Invesco S&P Equal Weight Technology ETF | RYT | 33.333% | 1.1880 | 05/01/2020 |
* - Dates prior to 8/15/2017, which is when the Invesco Dynamic Equal Weight Sector Model became available in the Invesco Weekly ETF Report, are representative of when the position was added to the backtested model.
| Group | Symbol | Percent | |
|---|---|---|---|
| Cash | CASH$ | 0.00% | |
| Invesco S&P Mid Cap 400 Revenue ETF TR | All US Mid Cap | RWK.TR | 40.00% |
| Invesco S&P Small Cap 600 Revenue ETF TR | All US Small Cap | RWJ.TR | 19.99% |
| Invesco S&P 500 Revenue ETF TR | Growth-Domestic | RWL.TR | 20.00% |
| Invesco S&P Ultra Dividend Revenue ETF TR | Growth & Income | RDIV.TR | 20.00% |
Invesco (Mon.)
Loading, Please Wait...
