Most Requested Symbols


Small-cap equity groups continue to show score improvement on the Asset Class Group Scores (ACGS) page, as shown through the US Styles view of the group rankings. This view reveals that each of the respective small-cap styles of growth, blend, and value rank ahead of their respective counterpart large- and mid-cap groups. This is the first time small-caps have outscored each of the other size classifications since late-2018. Growth continues to lead the way across each of the size classifications, however, value has improved significantly with small-cap value closing in on the 3 score threshold at a recent score posting of 3.82. That group continues to possess the highest score direction of any group on the US Styles view with a recent posting of 2.24. It should also be noted that each of the small-cap groups is now in heavily overbought territory on the ACGS page, with each possessing an average weekly OBOS reading north of 125%. While there may be actionable names within the small-cap space, keep a close eye on the respective OBOS readings of any individual funds to which you are looking to gain exposure as it may be best to wait for a pullback or trading band normalization.

The laggard improvement seen in the US equity space has also carried over to international equities, as many individual countries that have remained out of favor throughout the global equity rally are showing signs of improvement. This is a theme we have seen displayed earlier this year, as the consistent strength demonstrated by China ultimately led other Asian equities to elevated score territories as well. More recently, the Latin America group has shown a rapid rise in its score as it crossed back above the 3.00 threshold for the first time since January to reach its current position at 3.32. Latin America has been unable to maintain a score above 3.00 for more than a few months since its swift descent in the fourth quarter of 2018.
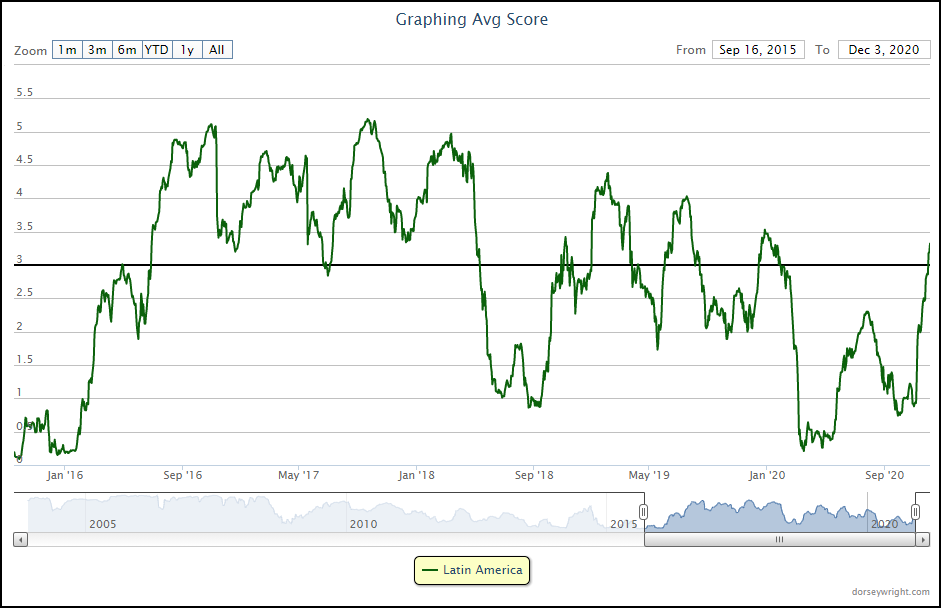
The recent rise in strength for Latin America has coincided with a continued weakening of the US Dollar. This is not a new phenomenon by any means, as the past few years have seen a starkly inverse relationship between the scores for the iShares S&P Latin America 40 ETF ILF and the Invesco DB US Dollar Index Bullish Fund UUP, as representatives for each space. ILF comes in at a recent score posting of 3.85 paired with a strongly positive score direction of 3.41. On the other hand, UUP possesses a fund score of 0.05 and an intensely weak score direction of -3.57, after moving to a new multi-year low of $24.50 Thursday. These two scores have demonstrated a history of moving in opposing directions over the past five years, as the most significant rises in fund score for ILF have come at times of weakness for UUP. This relationship will be important to monitor as we look to see if the recent strength from Latin America can be sustained.

Mutual Fund Reports
Loading, Please Wait...
