
Most Requested Symbols

There were no changes to the KraneShares Dynamic China Rotation model this week as each of the holdings continued to maintain sufficient relative strength among the model inventory.
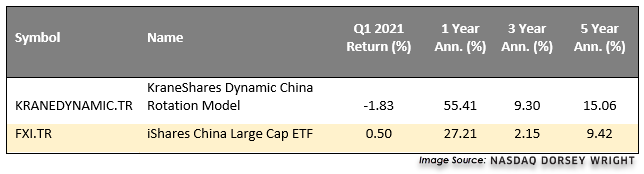
This week will cover our quarterly review for the KraneShares Dynamic China Rotation Model after the first three months of 2021. The model posted a return of -1.83% in the first quarter, underperforming the benchmark FXI.TR, which gained 0.50%. However, the mode continues to outpace the benchmark over a trailing 12-month timeframe, at a gain of 55.41% compared to 27.21%.
There were two changes to the model in the first three months of the year, with the KraneShares CSI China Internet ETF KWEB being purchased on January 11 and then sold on March 29. The model begins Q2 with six of the equity-focused funds included as model holdings.

The table below is a review of important technical data on a select group of KraneShares ETFs. Significant changes within the past week are highlighted in Green if positive or Red if negative. This portfolio is designed to be used as a "radar" screen to bring your attention to potentially important technical changes that may require your attention and potential action. When evaluating the Fund Score, the strongest issues have scores of 4 or higher while those ETFs with scores below a 3 are no longer considered solid citizens.
| Symbol | Name | Price | Yield (%) | PnF Trend | RS Signal | RS Col. | 200 Day MA | Weekly Mom | OBOS (Weekly) | ||
|---|---|---|---|---|---|---|---|---|---|---|---|
| KALL | KraneShares MSCI All China Index ETF | 35.31 | 1.01 | Positive | Sell | X | 33.30 | -7W |
|
||
| KARS | KraneShares Electric Vehicles & Future Mobility Index ETF | 43.80 | 0.14 | Positive | X | 35.25 | -9W |
|
|||
| KBA | KraneShares Bosera MSCI China A ETF | 45.20 | 0.68 | Positive | Buy | X | 42.77 | -7W |
|
||
| KCCB | KraneShares CCBS China Corporate High Yield Bond USD ETF | 39.35 | 6.57 | Negative | Sell | O | 39.92 | +9W |
|
||
| KCNY | Kraneshares E Fund China Commercial Paper ETF | 34.62 | 2.33 | Positive | Sell | O | 33.92 | -18W |
|
||
| KEMQ | KraneShares Emerging Markets Consumer Technology Index ETF | 32.98 | 2.32 | Positive | O | 30.94 | -7W |
|
|||
| KEMX | KraneShares MSCI Emerging Markets EX China Index ETF | 31.45 | 1.61 | Positive | O | 26.91 | -13W |
|
|||
| KFYP | KraneShares CICC China Leaders 100 Index ETF | 31.95 | 2.65 | Positive | Sell | O | 31.22 | -7W |
|
||
| KGRN | KraneShares MSCI China Environment Index ETF | 41.88 | 0.01 | Positive | Buy | O | 36.34 | -10W |
|
||
| KMED | KraneShares Emerging Markets Healthcare Index ETF | 34.02 | 0.02 | Positive | X | 32.82 | +1W |
|
|||
| KURE | KraneShares MSCI All China Health Care Index ETF | 39.80 | 0.00 | Negative | Buy | O | 36.55 | +1W |
|
||
| KWEB | KraneShares CSI China Internet ETF | 77.98 | 0.29 | Negative | Buy | O | 75.72 | -7W |
|
||
| OBOR | KraneShares MSCI One Belt One Road Index ETF | 29.35 | 1.90 | Positive | O | 24.91 | -12W |
|
The distribution curve places each ETF on a bell curve according to their respective degrees of overbought or oversold status using a 10-week distribution. ETFs that are statistically oversold will appear on the left-hand side of the bell curve, while those that have become statistically overbought will appear on the right-hand side of the bell curve. Perhaps the most useful attribute of this feature is that it displays the entire universe on the curve at one time to give us a general picture of whether the KraneShares ETF universe is generally overbought on a near-term basis, or generally oversold. Our best opportunities are to buy strong relative strength ETFs that have regressed back toward mean conditions based on market weakness, or have become oversold based upon extreme market weakness. Weekly Distribution is a short-term gauge that is most helpful in timing entry and exit points, while the longer-term information of trend and relative strength is a more controlling factor in the decision of whether to buy or sell.
Average Level -29.35
Legend:

The KraneShares Dynamic China Rotation Model is designed to identify major themes in the Chinese marketplace through the use of the Point & Figure relative strength tools. For more information on the portfolio construction and back testing, see the model info file on the models page. (Note: The KraneShares ETF Models will be updated Tuesday mornings by 9:30 am EST)
Weekly Changes:
| ETF Name | Symbol | DWA Suggested Weighting | Yield | Date Added |
|---|---|---|---|---|
| KraneShares MSCI All China Health Care Index ETF TR | KURE.TR | 16.667% | 0.0003 | 03/30/2020 |
| KraneShares CICC China Leaders 100 Index ETF TR | KFYP.TR | 16.667% | 2.6542 | 07/06/2020 |
| KraneShares Bosera MSCI China A ETF TR | KBA.TR | 16.667% | 0.6769 | 02/25/2019 |
| KraneShares MSCI All China Index ETF TR | KALL.TR | 16.667% | 1.0119 | 08/29/2016 |
| KraneShares Emerging Markets Consumer Technology Index ETF TR | KEMQ.TR | 16.667% | 2.3201 | 06/08/2020 |
| KraneShares Emerging Markets Healthcare Index ETF TR | KMED.TR | 16.667% | 0.0246 | 11/04/2019 |
* - Dates prior to 10/15/2019, which is when the KraneShares Dynamic China Rotation Model became available on the NDW Research Platform, are representative of when the position was added to the backtested model.
KraneShares (Tue.)
LISTEN TO PODCAST
Apr 02, 2026
Loading, Please Wait...
