Most Requested Symbols

Chinese equities were muted over the past week. China’s consumer price index for the month of February rose 1.3% year-over-year (vs 0.9% expected), an increase from January’s 0.2% year-over-year CPI, which was largely driven by an increase in food prices (source: chinalastnight.com). The annual National People’s Congress (NPC), which runs between March 5-10, provided a GDP growth target between 4.5%-5.0% (source: prnewswire.com). This cautious growth target sets a manageable benchmark as the country advances steadily through 2026. This week, we highlight:
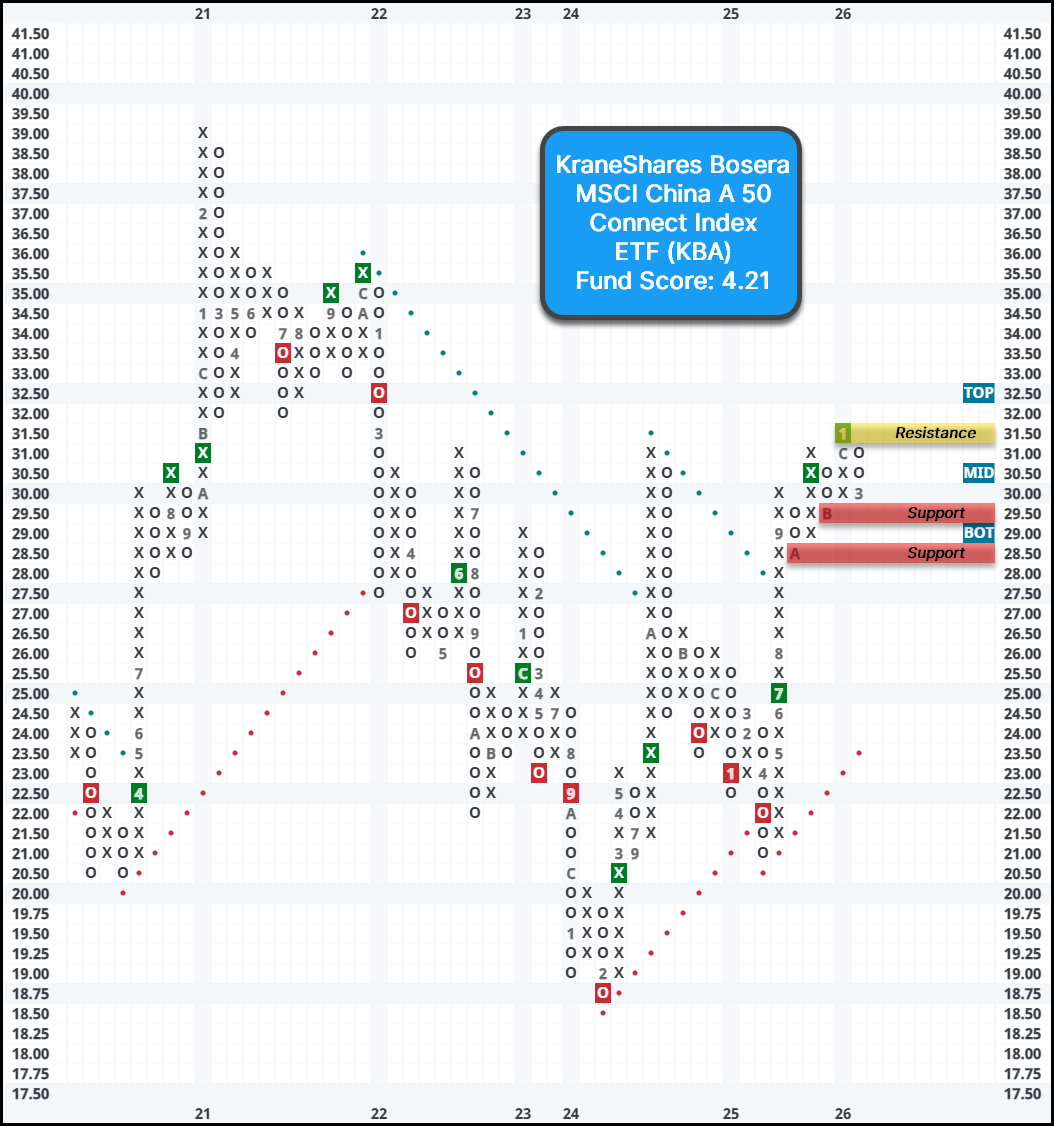
The KraneShares Bosera MSCI China A 50 Connect Index ETF (KBA) sits on three consecutive buy signals after completing a spread triple top break at $31.50 in January. KBA maintains a strong fund score of 4.21, well above technically acceptable for funds. The fund has slowed down in recent weeks, offering an attractive “buy on pullback” opportunity for those interested. Additionally, the fund offers a yield of 1.57. Long exposure can be added here. Initial support is at $29.50, with additional support at $28.50. Nearby resistance can be seen at $31.50.

The table below is a review of important technical data on a select group of KraneShares ETFs. Significant changes within the past week are highlighted in Green if positive or Red if negative. This portfolio is designed to be used as a "radar" screen to bring your attention to potentially important technical changes that may require your attention and potential action. When evaluating the Fund Score, the strongest issues have scores of 4 or higher while those ETFs with scores below a 3 are no longer considered solid citizens.
| Symbol | Name | Price | Yield (%) | PnF Trend | RS Signal | RS Col. | 200 Day MA | Weekly Mom | OBOS (Weekly) | ||
|---|---|---|---|---|---|---|---|---|---|---|---|
| KBA | KraneShares Bosera MSCI China A 50 Connect Index ETF | 30.27 | 1.57 | Positive | Buy | O | 28.51 | - 9W |
|
||
| KEMQ | KraneShares Emerging Markets Consumer Technology Index ETF | 23.58 | 5.08 | Positive | Sell | O | 23.67 | - 5W |
|
||
| KEMX | KraneShares MSCI Emerging Markets EX China Index ETF | 41.68 | 2.67 | Positive | Buy | X | 35.85 | - 2W |
|
||
| KGRN | KraneShares MSCI China Environment Index ETF | 27.87 | 0.84 | Negative | Sell | O | 28.19 | + 11W |
|
||
| KHYB | KraneShares Asia Pacific High Income USD Bond ETF | 24.34 | 7.68 | Negative | Sell | O | 24.36 | - 5W |
|
||
| KURE | KraneShares MSCI All China Health Care Index ETF | 16.93 | 4.04 | Negative | Sell | O | 18.75 | - 3W |
|
||
| KWEB | KraneShares CSI China Internet ETF | 30.54 | 6.70 | Negative | Sell | O | 34.97 | - 6W |
|
The distribution curve places each ETF on a bell curve according to their respective degrees of overbought or oversold status using a 10-week distribution. ETFs that are statistically oversold will appear on the left-hand side of the bell curve, while those that have become statistically overbought will appear on the right-hand side of the bell curve. Perhaps the most useful attribute of this feature is that it displays the entire universe on the curve at one time to give us a general picture of whether the KraneShares ETF universe is generally overbought on a near-term basis, or generally oversold. Our best opportunities are to buy strong relative strength ETFs that have regressed back toward mean conditions based on market weakness, or have become oversold based upon extreme market weakness. Weekly Distribution is a short-term gauge that is most helpful in timing entry and exit points, while the longer-term information of trend and relative strength is a more controlling factor in the decision of whether to buy or sell.
Average Level -49.67
< - -100
-100 - -80
-80 - -60
-60 - -40
-40 - -20
-20 - 0
0 - 20
20 - 40
40 - 60
60 - 80
80 - 100
100 - >
Buy signalkhyb
Sell signalkweb
Sell signalkemq
Sell signalkure
Buy signalKBA
Sell signalKEMX
Sell signalkgrn
< - -100
-100 - -80
-80 - -60
-60 - -40
-40 - -20
-20 - 0
0 - 20
20 - 40
40 - 60
60 - 80
80 - 100
100 - >
Legend:

The KraneShares Dynamic China Rotation Model is designed to identify major themes in the Chinese marketplace through the use of the Point & Figure relative strength tools. For more information on the portfolio construction and back testing, see the model info file on the models page. (Note: The KraneShares ETF Models will be updated Tuesday mornings by 9:30 am EST)
Weekly Changes:
| ETF Name | Symbol | NDW Suggested Weighting | Yield | Date Added |
|---|---|---|---|---|
| KraneShares Bosera MSCI China A 50 Connect Index ETF TR | KBA.TR | 50.000% | 1.5738 | 08/18/2025 |
| KraneShares Asia Pacific High Income USD Bond ETF TR | KHYB.TR | 50.000% | 7.6785 | 02/09/2026 |
* - Dates prior to 10/15/2019, which is when the KraneShares Dynamic China Rotation Model became available on the NDW Research Platform, are representative of when the position was added to the backtested model.
| ETF Name | Symbol | NDW Suggested Weighting | Yield | Date Added |
|---|---|---|---|---|
| KraneShares MSCI Emerging Markets Ex China Index ETF TR | KEMX.TR | 100.000% | 2.6683 | 12/31/2012 |
KraneShares (Tue.)
LISTEN TO PODCAST
Apr 02, 2026
Loading, Please Wait...
