Most Requested Symbols


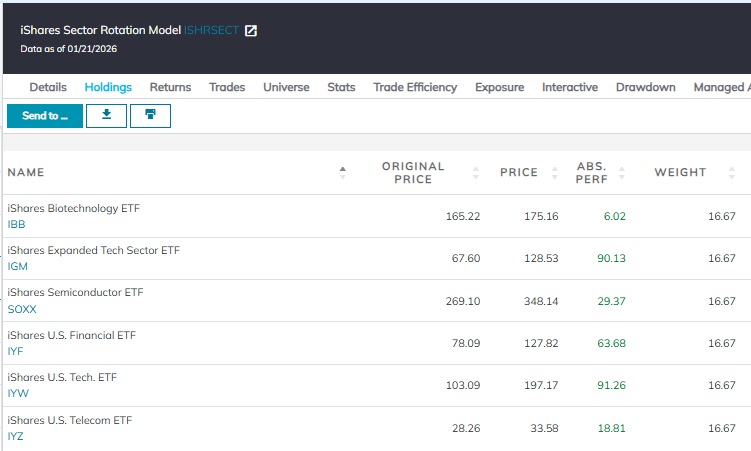
There is a change to the iShares Sector Rotation Model (ISHRSECT) this week: sell the iShares North American Tech-Software ETF (IGV). ISHRSECT utilizes a relative strength versus benchmark methodology which compares each fund in the model universe against the iShares Dow Jones US ETF (IYY). Those funds showing near-term relative strength against the benchmark (i.e., are in a column of Xs) are included in the portfolio and are removed only when they show weakness relative to the benchmark. When an addition or deletion is made, the portfolio is rebalanced so each position is equally weighted. IGV was sold because it reversed down into a column of Os against IYY demonstrating short-term weakness against the benchmark. With the removal of IGV, the model now has exposure to biotechnology, technology, semiconductors, financials, and telecom. Year-to-date (through 1/21) ISHRSECT has gained 0.78% on a price return basis, putting it roughly 35 bps ahead of the S&P 500 (SPX).

This section of the report categorizes select iShares Fixed Income and Currency ETPs by their respective fund groups. Along with each group, you can view the Average Group Score, which is an average of the scores of all funds represented in that particular group. Those iShares ETFs that meet or exceed the Average Group Score will be highlighted in green in order to easily view those ETFs that have superior strength within their respective group. You want to focus on those ETFs that exhibit superior strength when looking to add new exposure to a particular group.
Global Fixed Income
Symbol
Name
Score
Average Group Score: 3.4
ISHG
iShares S&P Citigroup 1-3 Year Intl. Treas. Bond ETF
3.22
EMB
iShares JP Morgan USD Emerging Markets Bond ETF
2.95
IGOV
iShares S&P Citigroup International Treasury Bond ETF
2.28
High Yield
Symbol
Name
Score
Average Group Score: 3.1
HYG
iShares iBoxx $ High Yield Corporate Bond ETF
2.83
PFF
iShares Preferred & Income Securities ETF
1.55
Corporate Bonds
Symbol
Name
Score
Average Group Score: 3.0
IGSB
iShares Trust iShares 1-5 Year Investment Grade Corporate Bond ETF
2.65
LQD
iShares iBoxx $ Investment Grade Corp. Bond ETF
2.63
FLOT
iShares Floating Rate Note ETF
2.61
Municipal Bonds
Symbol
Name
Score
Average Group Score: 2.8
SUB
iShares Short-Term National Muni Bond ETF
2.89
CMF
iShares California Municipal Bond ETF
2.66
NYF
iShares New York Muni Bond ETF
2.51
MUB
iShares National Municipal Bond ETF
1.49
Broad Fixed Income
Symbol
Name
Score
Average Group Score: 2.8
MBB
iShares Barclays MBS Fixed-Rate Bond ETF
2.94
IGIB
iShares Investment Grade Systematic Bond ETF
2.77
AGG
iShares US Core Bond ETF
2.65
USIG
iShares Broad USD Investment Grade Corporate Bond ETF
2.52
IGLB
iShares 10+ Year Investment Grade Corporate Bond ETF
2.33
Inflation Protection Bonds
Symbol
Name
Score
Average Group Score: 2.7
STIP
iShares Barclays 0-5 Year TIPS Bond ETF
1.80
TIP
iShares Barclays US Treasury Inflation Protected Securities
1.03
Agency Bonds
Symbol
Name
Score
Average Group Score: 2.4
AGZ
iShares Barclays Agency Bond ETF
1.54
Treasury Bonds
Symbol
Name
Score
Average Group Score: 2.4
SHY
iShares Barclays 1-3 Year Tres. Bond ETF
2.59
IEI
iShares Barclays 3-7 Year Treasury Bond ETF
2.54
IEF
iShares Barclays 7-10 Year Tres. Bond ETF
2.33
TLH
iShares Barclays 10-20 Year Treasury Bond ETF
1.82
GVI
iShares Barclays Intermediate Government/Credit Bond ETF
1.66
GBF
iShares Barclays Government Credit Bond ETF
1.64
TLT
iShares Barclays 20+ Year Treasury Bond ETF
1.16
The distribution curve places each ETF on a bell curve according to their respective degrees of overbought or oversold status using a 10-week distribution. ETFs that are statistically oversold will appear on the left-hand side of the bell curve, while those that have become statistically overbought will appear on the right-hand side of the bell curve. Perhaps the most useful attribute of this feature is that it displays the entire universe on the curve at one time with an "average level" to give us a general picture of whether the iShare ETF universe is generally overbought on a near-term basis, or generally oversold. Our best opportunities are to buy strong market ETFs that have regressed back toward mean conditions based on market weakness, or have become oversold based upon extreme market weakness.
Weekly Distribution is a short-term gauge that is most helpful in timing entry and exit points, while the longer-term information of trend and relative strength is a more controlling factor in the decision of whether to buy or sell. The Distribution Curve below displays those ETFs with positive RS in uppercase letters and those ETFs with poor RS versus the market in lowercase letters. As well, those ETFs that are on a Point & Figure Buy signal appear in Green letters, while those on Sell signals can appear in Red letters. Box Color indicates the Sector Status Rating. Green = Favored, Yellow = Average, and Red = Unfavored.
Average Level
56.36
| < - -100 | -100 - -80 | -80 - -60 | -60 - -40 | -40 - -20 | -20 - 0 | 0 - 20 | 20 - 40 | 40 - 60 | 60 - 80 | 80 - 100 | 100 - > |
|---|---|---|---|---|---|---|---|---|---|---|---|
|
Buy signalICLN
|
|||||||||||
|
Buy signalIHE
|
|||||||||||
|
Buy signalieo
|
Buy signalEWG
|
||||||||||
|
Buy signalixg
|
Sell signaliyk
|
||||||||||
|
Buy signaligf
|
Buy signalEPOL
|
Buy signalthd
|
|||||||||
|
Buy signalihf
|
Buy signalIAI
|
Buy signalewm
|
|||||||||
|
Buy signalRXI
|
Buy signalEWP
|
Buy signalEWO
|
|||||||||
|
Buy signalEWI
|
Buy signaleems
|
Buy signalewk
|
Buy signalITA
|
||||||||
|
Buy signaleido
|
Buy signaliyt
|
Buy signalixc
|
Buy signalIJH
|
Buy signalIEZ
|
|||||||
|
Sell signalicf
|
Buy signalEWT
|
Buy signalEWU
|
Buy signalemif
|
Buy signalige
|
|||||||
|
Buy signalenzl
|
Buy signalitb
|
Buy signalewn
|
Buy signalIAT
|
Buy signalmxi
|
|||||||
|
Buy signalFXI
|
Buy signalewa
|
Buy signalEUFN
|
Buy signaliev
|
Buy signaleww
|
Buy signalECH
|
||||||
|
Buy signalIXN
|
Sell signalIYC
|
Buy signalEWC
|
Buy signalgsg
|
Buy signalSOXX
|
Buy signalEWY
|
||||||
|
Buy signaljxi
|
Buy signalepp
|
Buy signalEZU
|
Buy signaliyj
|
Buy signalEEM
|
Buy signaliym
|
||||||
|
Buy signalIDU
|
Buy signalewq
|
Buy signalEWJ
|
Buy signalewl
|
Buy signalEIS
|
Buy signalilf
|
Buy signalIAU
|
|||||
|
Buy signalEWS
|
Buy signalIVV
|
Buy signalEWH
|
Buy signalkxi
|
Buy signalEWD
|
Buy signalEZA
|
Buy signalSLV
|
|||||
|
Sell signalIXP
|
Buy signalIYG
|
Buy signalIYY
|
Buy signalixj
|
Buy signalefa
|
Buy signaldvy
|
Buy signalexi
|
Buy signalEPU
|
||||
|
Sell signalindy
|
Sell signaligv
|
Buy signalIAK
|
Buy signalihi
|
Buy signalbkf
|
Buy signaliyz
|
Buy signalIBB
|
Buy signalEWZ
|
Buy signalijr
|
Buy signalwood
|
Buy signalTUR
|
|
| < - -100 | -100 - -80 | -80 - -60 | -60 - -40 | -40 - -20 | -20 - 0 | 0 - 20 | 20 - 40 | 40 - 60 | 60 - 80 | 80 - 100 | 100 - > |

This section of the report categorizes select iShares ETFs by their respective broad group. Along with each group, you can view the Average Group Score, which is an average of the scores of all funds represented in that particular group. Those iShares ETFs that meet or exceed the Average Group Score will be highlighted in green in order to easily view those ETFs that have superior strength within their respective group. You want to focus on those ETFs that exhibit superior strength when looking to add new exposure to a particular group.
| Large Cap Funds | Symbol | Name | Score |
|---|---|---|---|
| Average Group Score: 4.2 | IWB | iShares Russell 1000 ETF | 4.97 |
| IVW | iShares S&P 500 Growth ETF | 4.92 | |
| IYY | iShares Dow Jones U.S. ETF | 4.92 | |
| IWL | iShares Russell Top 200 ETF | 4.90 | |
| OEF | iShares S&P 100 ETF | 4.88 | |
| IVV | iShares S&P 500 Index | 4.87 | |
| IWX | iShares Russell Top 200 Value ETF | 4.34 | |
| IVE | iShares S&P 500 Value ETF | 3.91 | |
| IWY | iShares Russell Top 200 Growth ETF | 3.79 | |
| IWD | iShares Russell 1000 Value ETF | 3.40 |
| Small Cap Funds | Symbol | Name | Score |
|---|---|---|---|
| Average Group Score: 4.1 | IWO | iShares Russell 2000 Growth ETF | 5.37 |
| IWN | iShares Russell 2000 Value ETF | 4.57 | |
| IWM | iShares Russell 2000 ETF | 4.47 | |
| IJS | iShares S&P SmallCap 600 Value ETF | 4.22 | |
| IJR | iShares S&P SmallCap 600 Index Fund | 3.19 | |
| IJT | iShares S&P SmallCap 600 Growth ETF | 3.05 |
| Global Funds | Symbol | Name | Score |
|---|---|---|---|
| Average Group Score: 4.0 | EEM | iShares MSCI Emerging Markets ETF | 5.56 |
| ILF | iShares S&P Latin America 40 ETF | 4.95 | |
| IEV | iShares Europe ETF | 4.50 | |
| JPXN | iShares JPX-Nikkei 400 ETF | 4.47 | |
| EFA | iShares MSCI EAFE ETF | 4.43 | |
| BKF | iShares MSCI BRIC ETF | 3.85 | |
| EPP | iShares MSCI Pacific ex-Japan Index Fund | 3.83 |
| Sector Funds | Symbol | Name | Score |
|---|---|---|---|
| Average Group Score: 3.9 | SOXX | iShares Semiconductor ETF | 5.95 |
| IHE | iShares U.S. Pharmaceuticals ETF | 5.75 | |
| ITA | iShares U.S. Aerospace & Defense ETF | 5.73 | |
| IBB | iShares Biotechnology ETF | 5.61 | |
| IAI | iShares U.S. Broker Dealers & Securities Exchanges ETF | 5.60 | |
| IAI | iShares U.S. Broker Dealers & Securities Exchanges ETF | 5.60 | |
| IEZ | iShares U.S. Oil Equip. & Svcs. ETF | 5.36 | |
| IAT | iShares U.S. Regional Banks ETF | 5.27 | |
| IYF | iShares U.S. Financial ETF | 4.90 | |
| IYC | iShares US Consumer Discretionary ETF | 4.77 | |
| IGE | iShares North American Natural Resources ETF | 4.62 | |
| IYM | iShares U.S. Basic Materials ETF | 4.62 | |
| IYZ | iShares U.S. Telecom ETF | 4.26 | |
| IYW | iShares U.S. Tech. ETF | 4.16 | |
| IYH | iShares U.S. Healthcare ETF | 4.09 | |
| IYT | iShares U.S. Transportation ETF | 3.99 | |
| IYJ | iShares U.S. Industrial ETF | 3.91 | |
| IDU | iShares U.S. Utilities ETF | 3.56 | |
| IDGT | iShares U.S. Digital Infrastructure and Real Estate ETF | 3.51 | |
| IAK | iShares U.S. Insurance ETF | 3.26 | |
| IYE | iShares U.S. Energy ETF | 3.16 | |
| ITB | iShares U.S. Home Construction ETF | 2.72 | |
| IEO | iShares U.S. Oil & Gas Exploration & Production ETF | 2.49 | |
| IHI | iShares U.S. Medical Devices ETF | 2.36 | |
| IYK | iShares US Consumer Staples ETF | 2.22 | |
| IHF | iShares U.S. Healthcare Providers ETF | 2.08 | |
| IGV | iShares North American Tech-Software ETF | 1.21 | |
| ICF | iShares Select U.S. REIT ETF | 0.68 |
| Mid Cap Funds | Symbol | Name | Score |
|---|---|---|---|
| Average Group Score: 3.9 | IJH | iShares S&P MidCap 400 Index Fund | 4.22 |
| IWS | iShares Russell Midcap Value ETF | 3.35 | |
| IWP | iShares Russell Midcap Growth ETF | 3.32 | |
| IJK | iShares S&P MidCap 400 Growth ETF | 3.31 | |
| IJJ | iShares S&P MidCap 400 Value ETF | 3.19 | |
| IWR | iShares Russell Midcap ETF | 3.08 |
Weekly Updates: There is a change to the iShares Sector Rotation Model (ISHRSECT) this week: sell the iShares North American Tech-Software ETF (IGV).
| ETF Name | Symbol | NDW Suggested Weighting | Yield | Date Added |
|---|---|---|---|---|
| iShares Biotechnology ETF | IBB | 16.667% | 0.2293 | 11/19/2025 |
| iShares Expanded Tech Sector ETF | IGM | 16.667% | 0.1696 | 09/06/2023 |
| iShares U.S. Financial ETF | IYF | 16.667% | 1.3209 | 11/16/2022 |
| iShares U.S. Tech. ETF | IYW | 16.667% | 0.1383 | 05/31/2023 |
| iShares U.S. Telecom ETF | IYZ | 16.667% | 2.0438 | 02/26/2025 |
| iShares Semiconductor ETF | SOXX | 16.667% | 0.5717 | 09/24/2025 |
| ETF Name | Symbol | NDW Suggested Weighting | Yield | Date Added |
|---|---|---|---|---|
| iShares COMEX Gold Trust | IAU | 12.500% | 0.0000 | 05/07/2025 |
| iShares S&P 500 Index | IVV | 12.500% | 1.1740 | 12/20/2023 |
| iShares US Consumer Discretionary ETF | IYC | 12.500% | 0.5126 | 12/24/2024 |
| iShares U.S. Industrial ETF | IYJ | 12.500% | 0.8259 | 02/21/2024 |
| iShares U.S. Broker Dealers & Securities Exchanges ETF | IAI | 12.500% | 0.9502 | 08/14/2024 |
| iShares U.S. Aerospace & Defense ETF | ITA | 12.500% | 0.5476 | 03/15/2023 |
| iShares Semiconductor ETF | SOXX | 12.500% | 0.5717 | 01/14/2026 |
| iShares Silver Trust | SLV | 12.500% | 0.0000 | 11/19/2025 |
| ETF Name | Symbol | NDW Suggested Weighting | Yield | Date Added |
|---|---|---|---|---|
| iShares MSCI Italy ETF | EWI | 20.000% | 2.8088 | 05/10/2023 |
| iShares MSCI South Korea ETF | EWY | 20.000% | 2.0740 | 12/03/2025 |
| iShares MSCI Israel ETF | EIS | 20.000% | 1.4387 | 12/11/2024 |
| iShares MSCI Peru and Global Exposure ETF | EPU | 20.000% | 1.6469 | 06/05/2024 |
| iShares MSCI Poland ETF | EPOL | 20.000% | 4.8043 | 03/13/2024 |
iShares Fixed Income Model ISHRFIXED
ETF Name
Symbol
NDW Suggested Weighting
Yield
Date Added
iShares JP Morgan USD Emerging Markets Bond ETF
EMB
20.000%
4.9774
08/07/2024
iShares Global High Yield Corp Bond ETF
GHYG
20.000%
6.0572
02/08/2023
IShares Emerging Markets High Yield Bond ETF
EMHY
20.000%
6.5350
01/25/2023
iShares JP Morgan EM Corporate Bond ETF
CEMB
20.000%
5.1534
03/12/2025
iShares JP Morgan EM Local Currency Bond ETF
LEMB
20.000%
2.4510
01/18/2023
iShares (Thurs.)
LISTEN TO PODCAST
Feb 12, 2026
NDW MORNING UPDATE
Feb 12, 2026
Loading, Please Wait...
