Franklin ETFs Weekly Feature
Published: May 14, 2020
This content is for informational purposes only. This should not be construed as solicitation. The general public should consult their financial advisor for additional information related to investment decisions.
Highlighting recent improvement in the Franklin LibertyQ Global Equity ETF (FLQG).

The international equities asset class has seen continued long-term weakness from a relative-strength perspective, as it remains in the last place on our broad asset class ranking in DALI after falling to that position in March. Foreign equities have improved on an absolute basis over the past several weeks, in line with near-term strength from domestic equities, however, this improvement has been significantly more muted. The broad asset class has gained some buy signals in the DALI rankings, rising from a low of 65 signals to a recent posting of 82, although it still sits 30 signals below commodities.

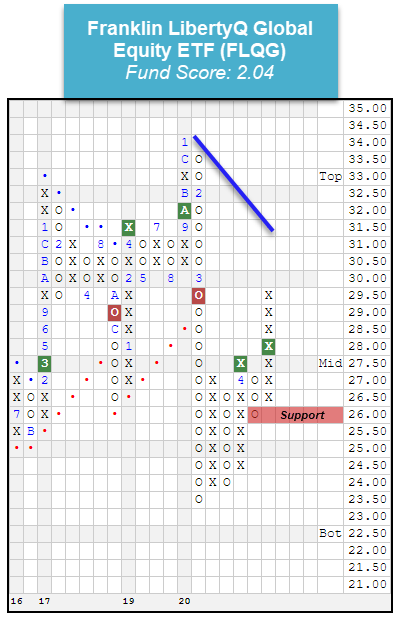
While the relative strength picture has remained largely unchanged, we have noticeable improvement taking place across many of the individual trend charts of broad global equity funds, in both developed and international market representatives. One such global fund is the Franklin LibertyQ Global Equity ETF FLQG, which has risen up from a near-term low of $23.50 to give two consecutive buy signals during its ascent to recent levels at $29.50. While this chart level is certainly improved, the fund still sits in an overall negative trend, although recent strength has led FLQG to near its long-term bearish resistance line that currently sits at $31.50, four boxes north of current levels. FLQG also offers a 3.61% yield and has a low relative-risk (rRisk) score of 0.87, making this a name to keep an eye out for further improvement in the weeks to come. Initial support can be found at $26.
Back to report

DISCLOSURE

Franklin Templeton Distributors has arranged with Dorsey Wright to provide this specialized ETF model which holds the Franklin LibertyShares ETFs. The Point & Figure analysis, models and resulting rankings, including any information, data or commentary included therein, are created and provided solely by Dorsey, Wright & Associates. Such analysis, models and rankings should not be considered an offer to purchase or sell, or a solicitation of an offer to buy or purchase any security, including Franklin LibertyShares ETF shares. Neither Franklin Templeton Distributors nor Dorsey Wright through this ETF page provide investment advice or recommendations regarding any security, fund or market. The percentage of the portfolio devoted to any ETF is at the sole discretion of the financial advisor or the customer, and not Dorsey, Wright & Associates or Franklin Templeton Distributors. If you are not familiar with the Point & Figure methodology, we suggest you read “Point & Figure Charting, 4th Edition” by Thomas J. Dorsey. If you are not familiar with the Franklin LibertyShares ETF product, or Exchange Traded Funds (ETFs), we suggest you visit www.libertyshares.com. The relative strength strategy is NOT a guarantee. There may be times where all investments and strategies are unfavorable and depreciate in value. Relative strength is not predictive and there is no assurance that forecasts based on relative strength can be relied upon.