Most Requested Symbols

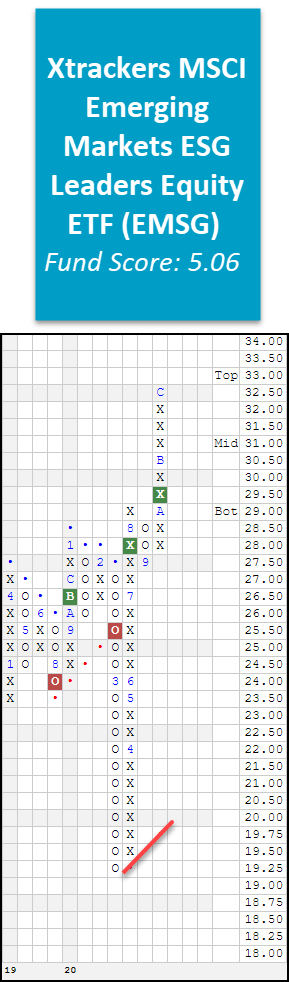
There are no changes to report this week. Today, we want to bring the chart of the Xtrackers MSCI Emerging Markets ESG Leaders Equity ETF EMSG to your attention as it currently sits at all-time highs and trades on two consecutive buy signals. As a refresher, EMSG seeks investment results that correspond generally to the performance, before fees and expenses, of the MSCI Emerging Markets ESG Leaders Index. The MSCI Emerging Markets (EM) ESG Leaders Index, is a capitalization-weighted index that provides exposure to companies with high Environmental, Social, and Governance (ESG) performance relative to their sector peers. MSCI EM ESG Leaders Index consists of large and mid-cap companies across 24 Emerging Markets (EM) countries. The Index is designed for investors seeking a broad, diversified sustainability benchmark with relatively low tracking error to the underlying equity market (source: DWS.com) In July, EMSG returned to a buy signal at $28 before breaking a second consecutive double top at $29.50 in October. Just this month, EMSG rallied to $32.50 which notched a new all-time high. From a scoring perspective, EMSG has a solid score of 5.06 and is outscoring the average emerging market equity fund by 0.73 score points, the average all Non-US fund by 1.20 score points, as well as the average all global & international fund by 1.23 score points. Currently, EMSG trades near the middle of the 10-week trading band with an overbought/oversold (OBOS%) reading of 14% overbought. From here, initial support sits at $27.50 while the bullish support line would be tested with a move to $19.75.

The DWA Monthly Currency Hedge Ratings are designed to provide you with an objective confidence rating for the major currency pairs. The ratings are based upon 3-12 month price momentum inputs, using monthly cross-rate data, and ratings range from 0-4. For currencies weakening and experiencing negative momentum relative to the US Dollar, the hedge rating will be high. For currencies strengthening and experiencing positive momentum relative to the US Dollar, the hedge rating will be low. The hedge percentage (Hedge %) can range from 0 - 100%. For currencies with a high hedge rating, a larger currency hedge exposure is indicated. The Hedge % uses a sliding scale in increments of 25%. For example, a currency with a Hedge Rating of 3 has a suggested Hedge % of 75%.

The table below is a review of important technical data on a select group of DWS Xtrackers ETFs. Significant changes within the past week are highlighted in Green if positive or Red if negative. This portfolio is designed to be used as a "radar" screen to bring your attention to potentially important technical changes that may require your attention and potential action. When evaluating the Fund Score, the strongest issues have scores of 4 or higher while those ETFs with scores below a 3 are no longer considered solid citizens.
Symbol
Name
Price
Fund Score
PnF Signal
RS Col.
PnF Trend
Weekly Mom
ACSG
Xtrackers MSCI ACWI ex USA ESG Leaders Equity ETF
30.90
5.05
Buy
X
Positive
-2W
ASHR
Xtrackers Harvest CSI 300 China A-Shares ETF
38.94
4.73
Buy
X
Positive
-4W
ASHS
Xtrackers Harvest CSI 500 China A-Shares ETF
34.52
4.10
Buy
X
Positive
-4W
ASHX
Xtrackers MSCI 300 China A Inclusion Equity ETF
28.79
4.80
Buy
X
Positive
-4W
CN
Xtrackers MSCI All China Equity ETF
43.35
4.39
Buy
O
Positive
-4W
DBAW
Xtrackers MSCI All World ex US Hedged Equity ETF
30.26
2.59
Buy
O
Positive
-2W
DBEF
Xtrackers MSCI EAFE Hedged Equity ETF
33.76
2.41
Buy
O
Positive
-2W
DBEM
Xtrackers MSCI Emerging Markets Hedged Equity ETF
26.88
3.20
Buy
O
Positive
-2W
DBEU
Xtrackers MSCI Europe Hedged Equity ETF
30.24
2.36
Buy
O
Positive
-2W
DBEZ
Xtrackers MSCI Eurozone Hedged Equity ETF
33.14
2.51
Buy
O
Positive
-2W
DBGR
Xtrackers MSCI Germany Hedged Equity ETF
29.19
2.68
Buy
O
Positive
+7W
DBJP
Xtrackers MSCI Japan Hedged Equity ETF
45.40
3.92
Buy
O
Positive
-2W
DEEF
Xtrackers FTSE Developed EX US Comprehensive Factor ETF
29.92
2.83
Buy
O
Positive
-2W
DEUS
Xtrackers Russell 1000 Comprehensive Factor ETF
38.39
4.97
Buy
O
Positive
-2W
EASG
Xtrackers MSCI EAFE ESG Leaders Equity ETF
28.90
3.15
Buy
O
Positive
-2W
EMSG
Xtrackers MSCI Emerging Markets ESG Leaders Equity ETF
31.51
5.06
Buy
O
Positive
-3W
EURZ
Xtrackers Eurozone Equity ETF
24.55
3.19
Buy
O
Positive
-1W
HAUZ
Xtrackers International Real Estate ETF
26.48
2.42
Buy
O
Positive
-2W
HDAW
Xtrackers MSCI All World ex US High Dividend Yield Equity ETF
23.93
2.78
Buy
O
Positive
-2W
HDEF
Xtrackers MSCI EAFE High Dividend Yield Equity ETF
23.10
2.89
Buy
O
Positive
-2W
JPN
Xtrackers Japan JPX-Nikkei 400 Equity ETF
32.20
3.14
Buy
O
Positive
-2W
SNPE
Xtrackers S&P 500 ESG ETF
32.68
5.25
Buy
O
Positive
-2W
USSG
Xtrackers MSCI USA ESG Leaders Equity ETF
33.82
5.05
Buy
O
Positive
-1W
Symbol
Name
Price
Fund Score
PnF Signal
RS Col.
PnF Trend
Weekly Mom
ESCR
X-Trackers Bloomberg Barclays US Investment Grade Corporate ESG ETF
22.81
2.51
Buy
O
Positive
-2W
ESEB
X-Trackers J.P. Morgan ESG Emerging Markets Sovereign ETF
22.49
2.51
Buy
O
Positive
-1W
ESHY
X-trackers J.P. Morgan ESG USD High Yield Corporate Bond ETF
21.04
2.58
Buy
O
Positive
-2W
RVNU
Xtrackers Municipal Infrastructure Revenue Bond ETF
29.19
3.24
Sell
O
Positive
-1W

The ETFs with the most relative strength buy signals (suggesting outperformance) versus the others in the group are listed at the top. These ETFs should be overweighted in the portfolio. Those ETFs with the least amount of relative strength buy signals versus the others in the group are listed at the bottom. These ETFs should be underweighted in the portfolio.
DWS Xtrackers Matrix Summary
| Ticker | Name | Buys | Xs | Tech Attribute/ Score |
|---|---|---|---|---|
| CN.TR | Xtrackers MSCI All China Equity ETF TR | 16 | 3 | 4.39 |
| ASHR.TR | Xtrackers Harvest CSI 300 China A-Shares ETF TR | 15 | 10 | 4.73 |
| ASHX.TR | Xtrackers CSI 300 China A-Shares Hedged Equity ETF TR | 14 | 10 | 4.80 |
| DBJP.TR | Xtrackers MSCI Japan Hedged Equity ETF Total Return | 11 | 6 | 3.92 |
| DEUS.TR | Xtrackers Russell 1000 Comprehensive Factor ETF TR | 10 | 14 | 4.97 |
| DBEM.TR | Xtrackers MSCI Emerging Markets Hedged Equity ETF TR | 9 | 12 | 3.20 |
| DBEZ.TR | Xtrackers MSCI Eurozone Hedged Equity ETF Total Return | 9 | 11 | 2.51 |
| DBEF.TR | Xtrackers MSCI EAFE Hedged Equity ETF Total Return | 8 | 7 | 2.41 |
| DBEU.TR | Xtrackers MSCI Europe Hedged Equity ETF Total Return | 8 | 4 | 2.36 |
| DEEF.TR | Xtrackers FTSE Developed EX US Comprehensive Factor ETF TR | 7 | 12 | 2.83 |
| JPN.TR | Xtrackers Japan JPX-Nikkei 400 Equity ETF TR | 7 | 11 | 3.14 |
| DBAW.TR | Xtrackers MSCI All World ex US Hedged Equity ETF Total Return | 7 | 4 | 2.59 |
| DBGR.TR | Xtrackers MSCI Germany Hedged Equity ETF Total Return | 4 | 5 | 2.68 |
| HAUZ.TR | Xtrackers International Real Estate ETF Total Return | 3 | 3 | 2.42 |
| HDEF.TR | Xtrackers MSCI EAFE High Dividend Yield Hedged Equity ETF TR | 1 | 6 | 2.89 |
| HDAW.TR | Xtrackers MSCI All World ex US High Dividend Yield Hedged Equity ETF TR | 1 | 5 | 2.78 |
| EURZ.TR | Xtrackers Eurozone Equity ETF Total Return | 0 | 13 | 3.19 |
| ETF Name | Symbol | DWA Suggested Weighting | Yield | Date Added |
|---|---|---|---|---|
| Xtrackers CSI 300 China A-Shares Hedged Equity ETF TR | ASHX.TR | 20.000% | 1.3439 | 03/30/2020 |
| Xtrackers Harvest CSI 300 China A-Shares ETF TR | ASHR.TR | 20.000% | 0.7591 | 03/23/2020 |
| Xtrackers MSCI All China Equity ETF TR | CN.TR | 20.000% | 3.2952 | 03/09/2020 |
| Xtrackers Russell 1000 US Quality at a Reasonable Price ETF TR | QARP.TR | 20.000% | 1.7251 | 02/03/2020 |
| Xtrackers MSCI USA ESG Leaders Equity ETF TR | USSG.TR | 20.000% | 1.0486 | 02/03/2020 |
* - Dates prior to 9/6/2016, which is when the Xtrackers Global Model Portfolio became available in the DWS Weekly ETF Report, are representative of when the position was added to the backtested model.
| ETF Name | Symbol | DWA Suggested Weighting | Yield | Date Added |
|---|---|---|---|---|
| Xtrackers MSCI Japan Hedged Equity ETF Total Return | DBJP.TR | 25.000% | 2.5859 | 03/23/2020 |
| Xtrackers CSI 300 China A-Shares Hedged Equity ETF TR | ASHX.TR | 25.000% | 1.3439 | 03/09/2020 |
| Xtrackers MSCI All China Equity ETF TR | CN.TR | 25.000% | 3.2952 | 12/29/2017 |
| Xtrackers MSCI Emerging Markets ESG Leaders Equity ETF TR | EMSG.TR | 25.000% | 3.4340 | 02/03/2020 |
* - Dates prior to 9/6/2016, which is when the Xtrackers All World Ex US Model Portfolio became available in the DWS Weekly ETF Report, are representative of when the position was added to the backtested model.
| ETF Name | Symbol | DWA Suggested Weighting | Yield | Date Added |
|---|---|---|---|---|
| Xtrackers MSCI EAFE Hedged Equity ETF Total Return | DBEF.TR | 33.333% | 2.1514 | 07/22/2019 |
| Xtrackers MSCI Eurozone Hedged Equity ETF Total Return | DBEZ.TR | 33.333% | 1.3638 | 06/24/2016 |
| Xtrackers MSCI Japan Hedged Equity ETF Total Return | DBJP.TR | 33.333% | 2.5859 | 03/23/2020 |
* - Dates prior to 9/6/2016, which is when the Xtrackers Developed Intl Equity Model Portfolio became available in the DWS Weekly ETF Report, are representative of when the position was added to the backtested model.
DWS (Tue.)
Loading, Please Wait...
