If you’ve felt like markets are broken recently, then you’re not alone. Today, we look at how to navigate a technology-driven market.
If you’ve felt like markets are broken recently, then you’re not alone. Most days during the last few months, the market will push higher while most participation indicators set new lows. When markets throw a curveball at investors, it can be easy to panic. Years of experience tell you this shouldn’t happen, suddenly leaving you confused at best and directionless at worst. It can be easy to throw up your hands and proclaim, “Everything is broken!” However, taking a step back and understanding what’s causing the change can provide additional context, as well as an idea of how to adapt going forward.
The Great Tech Disconnect
Previous years have seen divergences between the market and the average stock, with 2023 being the most recent extreme. However, few years, if any, have seen as much of a divergence between technology and non-technology stocks. One way to measure this divergence is by evaluating the correlation between the technology and non-technology stocks.

During an average period, there’s around a 70% to 75% correlation between the Select Sector Tech Fund (XLK) and the S&P 500 Ex-Tech & Comm Services Index (SPXXTTSP), meaning that technology usually follows the rest of the market closely. Over the past six months, the correlation between the two groups has been a meager 3%, which is easily the lowest on record. Said differently, technology stocks have essentially moved independently of the rest of the market over the last six months. The previous low in correlation from 25 years ago was still 22%, making recent action an incredibly sharp departure from the last few decades.

Technology-Driven Upside
The second factor causing divergence has been that upside in the market has come almost exclusively from technology. Over the past six months, the S&P 500 ex-tech and comm services index has risen 4.1%. However, that pales in comparison to the 40% return of XLK during that same period. If breadth isn’t tracking technology as closely, and tech is disproportionately responsible for upside, then participation indicators will have a harder time reflecting where cap weighted indices move.

As a side note, the six-month spread of outperformance in favor of tech was as high as 47.1% in September, which is the widest since the start of the dot com bubble in 2000. The AI buildout continues to draw parallels to that period, and with the only comparable period of outperformance coming from then, it does raise a potential sign of caution.
Navigating a Technology-Led Market
With the lack of recent correlation and AI transforming the economy, it may make sense to view technology as somewhat disconnected from the average stock until things normalize. Encouragingly, we have seen an uptick in correlation for technology compared to recent months. The current one-month correlation of tech to non-tech stocks is 35%, which is up from a low of negative 32% in September. That’s also the highest it’s been since the start of May, so it could be on the cusp of returning to normal.
Even assuming things don’t normalize soon, participation can still gauge the health of the average stock and the other nine non-AI major sectors. The equal weight and ex-tech/comm services versions of the S&P 500 have mirrored the decline of most participation indicators over the past several months, despite the abnormal behavior in technology.
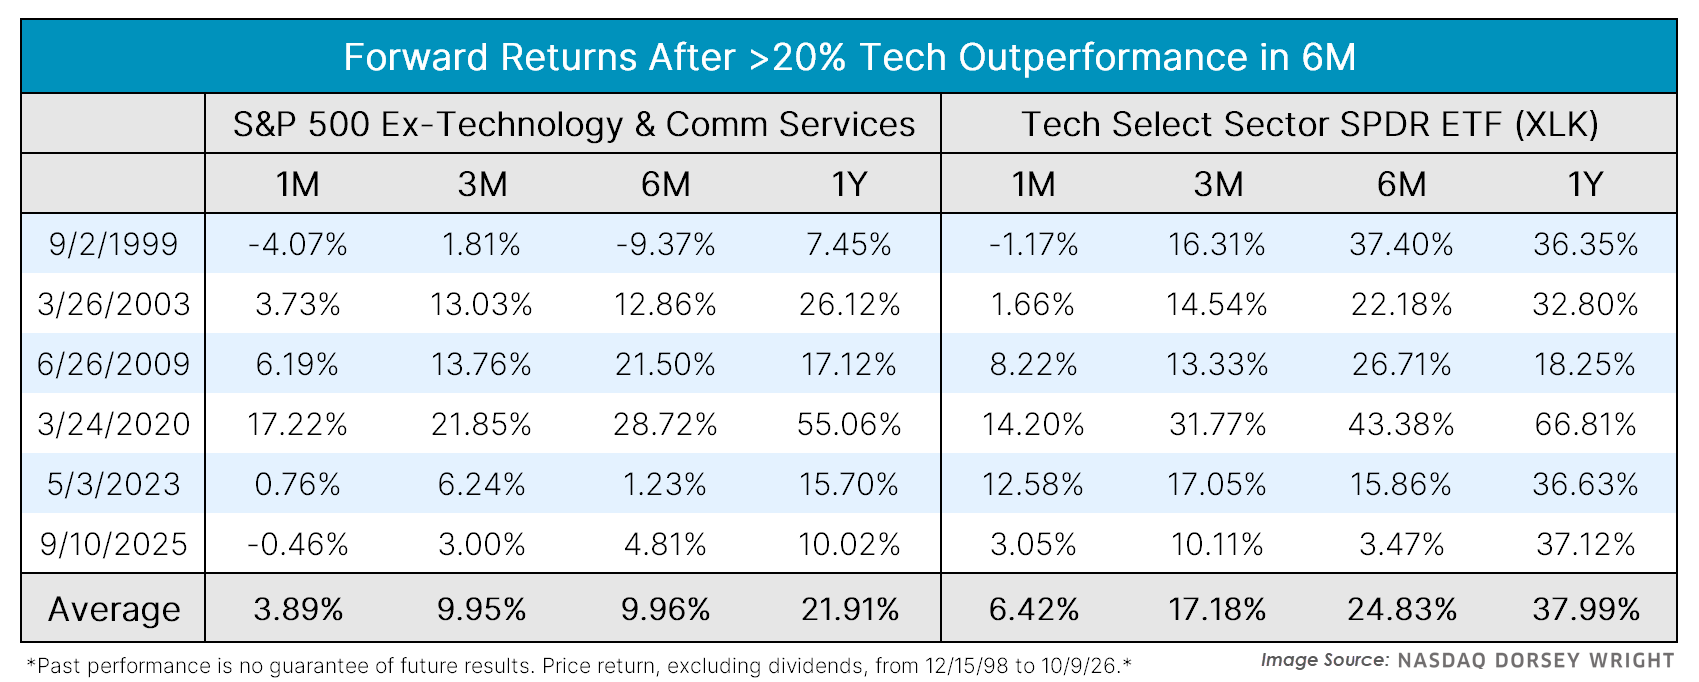
Additionally, investors can continue to overweight technology if it remains the primary driver of market gains. Technology handily outperforming other areas of the market isn’t always a bad thing either. There have been six periods, excluding clusters, in which tech beat non-tech stocks by more than 20% in a six-month span (while lower than current levels, it’s still historically high). Even including the lead-up to the dotcom bubble, those previous occasions were positive for both tech and non-tech stocks over the following year. The average one-year forward return of the ex-tech index exceeded 20% following those initial instances. Meanwhile, technology tended to continue its streak of outperformance. In each of the six initial instances, XLK outpaced non-tech stocks over the subsequent year, averaging a 38% return. While history never repeats, the current posturing of technology at the top of DALI further supports the idea that tech could be due for further upside, even if the risk of downside remains present as well.