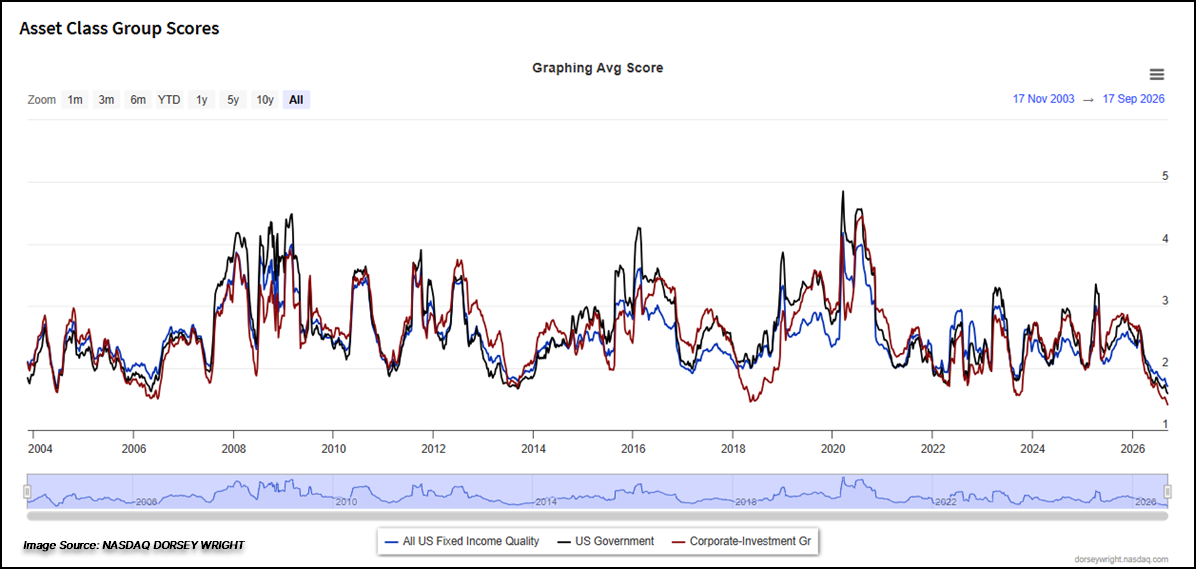
Prior to Wednesday’s (9/16) Fed meeting and announcement of a 25-basis point rate increase, interest rates and fixed income charts witnessed notable moves in advance. Pushing some areas of the fixed income space to historically low technical characteristics.
Wednesday’s session saw the Fed raise interest rates for the first time since 2023, with Fed Chair Walsh taking a hawkish stance and hinting at an additional quarter point hike later this year. Prior to Wednesday’s (9/16) Fed meeting and announcement of a 25-basis point rate increase, interest rates and fixed income charts witnessed notable moves in advance. Just since the beginning of the month, the U.S. Treasury 10-Year Yield Index (TNX) moved above 4.8% (48.00 on the point and figure chart) before eclipsing the 5% threshold to kick of this week’s trading, marking the highest chart level since July 2007.

With the TNX and other interest rate charts rallying, the broader fixed income representative, the iShares U.S. Core Bond ETF (AGG), fell to $95.75. Prior to reaching its lowest level since January 2025, the fund gave two sell signals and saw its trend shift to negative. This brings the chart down to support that dates back to May 2024 and still resides within the rangebound trading band that the fund has maintained since that time. Beyond current support, additional can be found at $95, the April 2024 chart low, before reaching levels not seen since late 2023. Recent downside action for AGG has brought the fund score for the ETF down to an abysmal 0.66 (out of 6). While not the worst fund score for AGG in its score history dating back to 1993, it ranks in the 97th percentile. For a number of the fixed income groups evaluated on the Asset Class Group Scores page, recent group scores have fallen also to all-time low levels.

Before diving into which groups have fallen to historic low points, it is worth highlighting the current position of the All Fixed Income group, which includes all fixed income-related ETF and mutual funds on the NDW platform. As of trading on 9/17, the All Fixed Income group maintains a group score of 2.01, marking its lowest level since May 2022 and ranking 112th (out of 134 total asset groups). The All Fixed Income group’s score sits above that of funds like AGG (discussed above) due to groups like convertibles, floating rate, and international maintaining strength relative to their peers, propping up the score slightly. Likely the more notable point in terms of the All Fixed Income group’s positioning is that it just sits above U.S. Money Market (1.99). While the crossover of All Fixed Income and U.S. Money Market hasn’t occurred just yet, it is worth highlighting that this the first time since late 2023 that the two have scored near each other. Prior to late 2023, U.S. Money Market had a score near or above All Fixed Income since early 2022, encompassing the last notable rising rate cycle. Before then, the last time U.S. Money Market scored above All Fixed Income was from February 2008 to March 2009. Apart from these two instances, the score history highlights two shorter periods from late 2005 to mid-2006 and a three-month period in mid-2007.

Within the All Fixed Income view on the Asset Class Group Scores page, nine out of the 38 fixed income asset groups maintain a score of 2 or below. While many of these low scoring fixed income groups are near low points in their score history, a handful are currently maintaining their lowest scores in their history going back to 2003 (the beginning of the score history for many groups on the ACGS page). The U.S. Government – Long and U.S. Fixed Income Long Duration rank 133rd and 134th out of 134 asset groups evaluated, marking their lowest rankings in the score history. More notably, the Corporate – Investment Grade, All U.S. Fixed Income Quality, and U.S. Government groups also reside at their lowest group scores in their score history, marking noteworthy weakness in what have long been seen as group that have maintained positions in the upper echelons of the fixed income asset class. While leadership within the broader asset class has favored convertibles, high yield, and international for the better part of the past three years, the weakness within the asset class has fallen to historic lows. While there are still major headwinds for fixed income prices and there is no timetable for when groups might rebound from historic low points, it will be worth monitoring for potential improvement off those lows and the potential impacts seen elsewhere.