
Near term participation indicators have been declining while long-term relative strength remains steady.
Markets seem to be getting into the Halloween spirit early this year due to a growing list of concerns leaving many investors spooked to kick off September. There are continued concerns around the ongoing war with Iran and how that impacts energy prices moving forward. Over the weekend, we got fresh headlines stoking AI fears, as the leaders of the frontier-AI companies came together in support of slowing down the pace of AI advancements due to security concerns. We also have midterm elections on the immediate horizon, which will likely influence more headlines as we get closer to the beginning of November. Regardless of how we feel about these headlines, it is our job as technical analysts to remain objective and examine the price action for what it is. That price action has led to some notable indicator developments, with near-term participation indicators flashing yellow caution lights.
There are many different participation indicators on the NDW platform that are helpful in different ways. We discussed several of these indicators in-depth in Friday’s feature. Two of the most popular near-term participation indicators we have on the NDW system are the Ten Week for the S&P 500 (^TWSPX) and the NYSE High Low Index (^NYSEHILO), which can be found right on the Research Hub. These two indicators have each been moving lower, suggesting that fewer and fewer stocks are participating in positive market action. In other words, the soldiers are leaving the battlefield.
The TWSPX measures the percentage of stocks in the S&P 500 Index that are trading above their ten-week, or 50-day, moving average. That indicator has been generally declining for several weeks, dropping to a recent chart level of 34%. A lower TWSPX indicates a more washed-out market environment. Currently, the declining level points toward near-term weakness that has yet to reach what we would consider washed-out territory.
The NYSEHILO index is slightly more complicated, as it measures the percentage of stocks making a new 52-week high relative to stocks making a 52-week high or low. When this indicator is falling, it points toward weak breadth, as there are a lot of stocks making fresh lows and not as many making new highs. The NYSEHILO has fallen to a chart level of 26%, marking its lowest level since the tariff tantrum last spring.

With signs pointing toward soldiers exiting the fight, where does that leave the broader market moving forward? There are different ways to understand the long-term strength of the US equity market, with a few options available on the NDW platform. One tool is the US Equity Core Percentile Rank (CorePR), which is found on the Asset Class Group Scores (ACGS) page. While this reading is a percentage-based indicator, it is different than the aforementioned participation indicators. The CorePR measures the percentage of other assets that the S&P 500 Index Funds group scores above out of more than 134 groups on the entire ACGS page. This indicator currently sits at 98%, as the Core equity market sits near the top of the rankings.
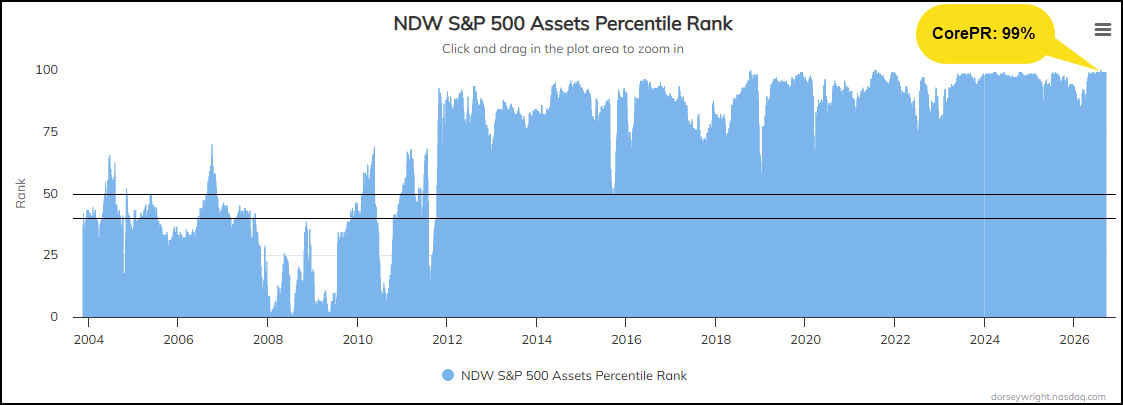
It is rare to see the CorePR sitting above 95% when the NYSEHILO falls below 30%. That has only happened nine other times since 2003, after removing clusters of consecutive days. We can narrow that down to just six days if we eliminate clusters within three months, aligning closer to the current environment.
We did not see this occur until 2014, mainly because we did not see the CorePR push above 95% until that year. The indicator spent the entirety of the “lost decade” of the 2000s in lower field position since there were other assets around the globe performing well. The Global Financial Crisis at the end of that decade led to all-time lows for the CorePR, and the recovery took some time.
Since 2014, we have generally seen a very elevated position for the CorePR, which makes sense given the strength of the domestic equity market. Examining forward returns for the State Street SPDR S&P 500 ETF Trust (SPY) shows that the market benchmark has higher-than-average returns when the CorePR is above 90%. However, the average forward returns dip below the all-time average in the near-term ranges (since the origin of the CorePR reading in 2003) when you focus on just days that saw the CorePR sit north of 95%, which is over 19% of the days in our study window.
Looking deeper at the forward returns from days the NYSEHILO dips below 30% while the CorePR is above 95% is a mixed bag. The average forward returns in the six focused years (ex-clusters) are notably lower across each forward window, but especially in the forward 30 days and 90 days. That is due to sharp weakness seen in three specific years, including 2018, 2021, and 2023.

In summary, the eerie feeling you may have about US equity markets could be warranted with the declining near-term participation. Domestic equities were not able to hold onto the top spot on our DALI rankings, losing out to more consistent improvement from international equities. We have also seen an uptick in volatility (as discussed in last Thursday’s feature), with elevated potential for further volatility as we head toward the midterm elections. These reasons, when taken alongside the declining breadth, can be taken as a yellow caution light. This does not mean you should scrap your process for fear of the light turning red. Instead, this could be a time to wait to put new cash to work, leave allocation in cash if current positions break down, or consider easing into new positions as we wait for breadth to pick back up.
