Along with the pullback in indices, short- to intermediate-term indicators have witnessed decreases to varying degrees. Most notably this week, the bullish percent (BP) for NYSE stocks (^BPNYSE) reversed down into Os following Monday’s (8/31) trading and fell to 50% on the chart with action on 9/1.
This week’s trading within U.S. equity indices has been mixed, with the S&P 500 Index (SPX) up 49 basis points and S&P 500 Equal Weight Index (SPXEWI) down 30 basis points (thru 9/3), continuing similar trading that capped off the final two weeks of August. After a number of indices made highs in the first half of August, most of have pulled back and consolidated at or above the middle of the 10-week trading band (50-day moving average).
Along with the pullback in indices, short- to intermediate-term indicators have witnessed decreases to varying degrees. Most notably this week, the bullish percent (BP) for NYSE stocks (^BPNYSE) reversed down into Os following Monday’s (8/31) trading and fell to 50% on the chart with action on 9/1. While we can say roughly half of the 1800+ stocks within the NYSE universe, the BP reading of 49.47% technically suggests that the number of stocks on sell signals is slightly higher than those maintaining buy signals. Reversals higher or lower on BP charts are often a point of interest and a reminder to check in on portfolios; assessing which stocks maintain a buy signal, and which have given a sell signal(s) and shown notable technical deterioration. Whether it be a violation of notable support, or a change within technical attribute rating, changes in indicators serve as a reminder to evaluate; keeping the positions contributing positively and culling out those with negative technical changes.
Seeing the BP indicator ebb and flow, highlighting moving participation within the market, is commonplace. But the BPNYSE has ranged almost entirely within 40% to 60% for much of 2026, marking the first time since 2019 we've seen such rangebound action at these levels, adding to just a few other years in the late 90s and early 00s. Additionally, and more notably, the BP has now gone more than 5 years since it last moved above the 70% mark, or even above 64% on the chart. Only one other period from early 1998 to mid-2003 (1284 trading days) witnessed a similar feat, and the current streak has exceeded that streak by more than 20 trading days and is still counting.

The table below highlights forward returns of the S&P 500 Index (SPX) over various time frames when the bullish percent chart for the NYSE resides in Xs or Os at various levels. This table has been featured many times throughout the years, and the most notable takeaway is better performance at extremes—either very washed-out territory (low BP readings) or elevated territory (high BP readings). Though trips below 30% (oversold territory) and below 20% (washed out territory) occurred in the 5 year period, the market’s recent elevated territory trips have ended in the mid-60s, not reaching above 70% since 2021. Long-term forward returns when the BP maintains middling readings have proved positive, but the short- to intermediate-term forward returns highlight some challenges. Moves to lower levels on the BP chart indicate environments when long-term leadership changes provide opportunity, while higher BP chart levels indicate an environment where long-term leadership is maintaining.

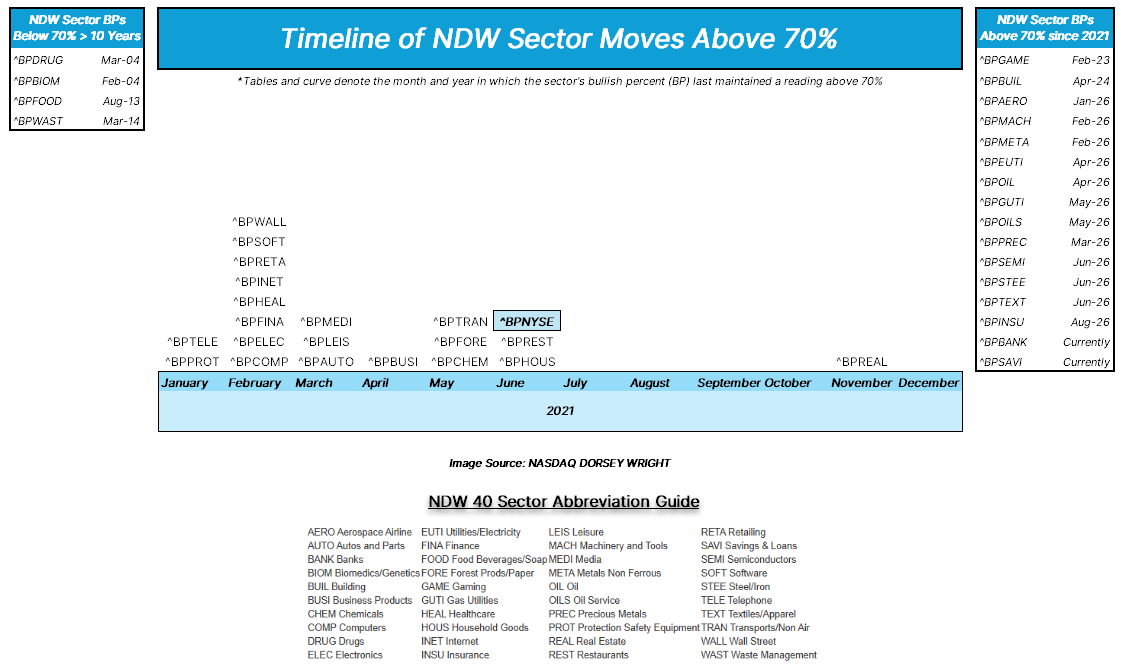
While performance has been positive annually since 2022 for the S&P 500 with the BP for the NYSE seeing a ceiling in the mid 60%, it has been defined by periods of a select few sectors or groups of stocks carrying the brunt of those returns. Given the market environment, over half of the NDW 40 sector bullish percents (BPs) have seen similar action as to the ^BPNYSE, unable to move past a ceiling on the chart in terms of participation. The timeline below takes a look at those 40 NDW sector BPs and the last time each pushed past a prior chart ceiling and made a visit to elevated territory (BP reading > 70%). First, note those BP charts in the table to the right that have visited elevated territory.The broader sectors like industrials, utilities, financials, and even cyclicals have seen multiple NDW sectors with high participation readings. Notably, the only technology-related NDW sector to see elevated readings within the last five years has been semiconductors. The remaining technology subsectors reside with the 20 NDW sector BPs that have not seen a move to elevated territory since 2021. While food & beverage and waste management NDW sectors have gone more than a decade since a visit to elevated territory, NDW sectors like biotech and drugs have such large universes that BP visits above 60% have only happened one or two times in 20+ years.
While some NDW sector universes' sizes and makeup—such as larger number of small cap participants—vary, it isn’t hard to tell what NDW sectors are the ‘have and have nots’ in terms of offering opportunities in recent years. Given the sustained period with which many of the BPs have gone without visits to elevated territory, one might assume a regime change might come sooner or later. Moving forward, it will be worth monitoring many of the aforementioned BPs to see which areas of the U.S. equity market may emerge with higher participation and new leadership.