
Communication services has fallen to its lowest position in nearly 2 years. We discuss said weakness today.
Extra, Extra, Read All About It! Communication services is at its lowest position within the NDW DALI Sector rankings in nearly two years. Sitting in 7th, the sector has struggled mightily so far in 2026, lagging several other areas of the investable universe. Down almost 6% so far this year, XLC has underperformed the broad market (SPX) by nearly 18%. With the lack of upside action, XLC has dropped significantly in fund score, now scoring at a sub-optimal 2.60 fund score as of 9/1. The fund has scored below NDW’s technically acceptable 3.0 fund score since late May, and its overall technical posture has become increasingly difficult to defend even as other risk-on areas of the market continue to march forward.

Speaking of other areas of the market, many of you will closely associate the communication services sector with technology. After all, the comm services sector at large was a spinoff of technology starting in 2018, bringing media giants over into their own group and taking some market weighting out of the technology sector. Side note: the introduction of the communication services sector brought technology’s weight in the S&P 500 down to ~20% after claims that the market had become too reliant on the sector. The current weight of technology within the S&P 500 today sits at nearly double that- is it time for a “semiconductors” sector?
Jokes about market concentration aside, it certainly isn’t “wrong” to lump together technology and communication services together. After all, the two seem to generally move in tandem. The chart below shows the rolling six-month performance spread between representatives XLK & XLC since mid-2000. On average, the six-month performance spread sits at just 1.52% (1.43% median) favoring XLK. Over the last six months, this spread has ballooned to nearly 38%, which would equate to a 99.7th percentile move. While it goes without saying that an elevated spread doesn’t necessarily mean one group is due to accelerate/slow down, it does help contextualize the dispersion in returns.

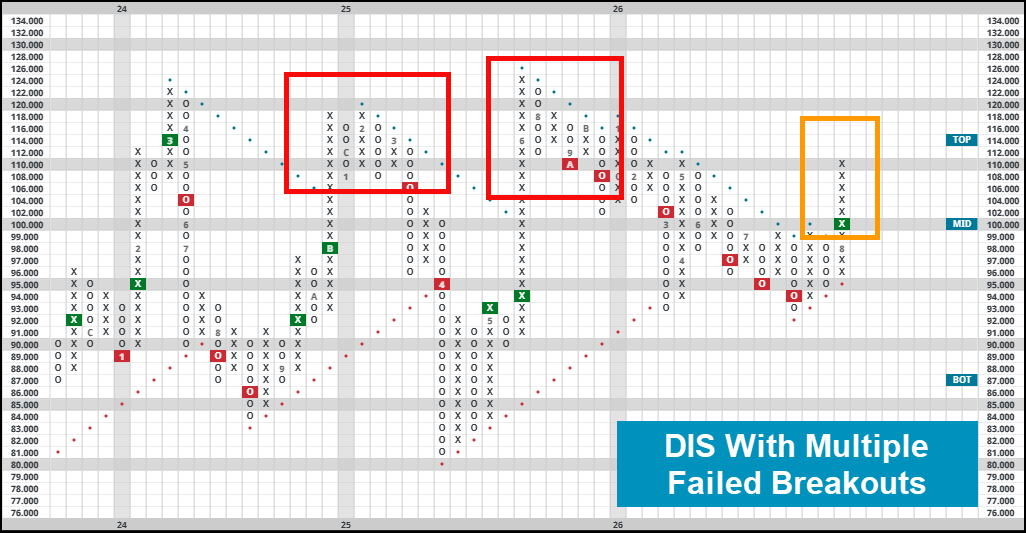
Underneath the hood of the sector, there are plenty of household names that would be part of anyone’s “buy what you know” portfolio. Perhaps the largest non-pure-tech-focused of the bunch would be Disney, which has been quite interesting to follow over the last few years. Like clockwork, DIS has strung together failed breakout after failed breakout as upward action has been quickly beaten down by bears. After breaking back into a positive trend to open August, another failed breakout here could send Mickey Mouse back towards 2026 lows at $93. Keep a close eye on reversals for those of you who might be willing to open short/bearish positions to take advantage of the 1/5’er’s rangebound movement.
More tech-oriented META has struggled so far in 2026, earning a lousy 0/5 technical attribute rating as it continues to flirt with 2026 lows. While bulls have been quick to defend the $525 mark, META has put in a string of lower highs (and failed breakouts for that matter) since its highs last August. It looks to be forming a sort of triangle pattern on its default chart, with landmarks on either side of current levels ranging from 2026 lows at $528 and a slew of resistance from $592 to the bearish resistance line at $640. For now, the path of least resistance looks to be lower. Even highflier Alphabet (GOOGL), (GOOG) looks to have slowed down. While still positive for the year, it trades well off highs and the all-time highs from May seem a ways away. Now only a 3/5’er, the TA scoring system would suggest we hold off on adding any new allocation for now.
Remember, you can certainly find strong technical pictures across any given sector... even weakening ones. That said, it may be slightly more difficult to do so, and the penalty for being “wrong” may be more intense than in those areas that sector tailwinds are on your side. Regardless, keep an eye on the charts to help you decipher price action as it emerges within your portfolio.

