Most Requested Symbols

A new asset class has overtaken international equities at the top of DALI's rankings.
International equities have fallen in DALI but the overall momentum environment within the space remains quite productive. We discuss how to take advantage of this in today's featured article.
NDW Morning Pulse - August 19, 2026
Below are highlights from the NDW Morning Update Video for the morning of 8/19. Access the video on the NDW Morning Update Video page.

Domestic and international equities have been focal points of relative strength within DALI’s asset class rankings over the last several months. However, with movement earlier this week, we saw domestic equities move back to top spot in DALI for the first time since February, leaving international equities closely behind in second. However, the shift in favor of the US market hasn’t been due to weakness from foreign markets. Over the last three months, international equities picked up 8 signals, but domestic equities gained 23 signals over that same span, underscoring the recent strength of both groups.

Changes at the top of DALI are important to take note of, as the power of number one has a long track record of success. Investing in the top asset class at the end of every month would have grown a portfolio of 100k to more than 500k since the start of 2000, outperforming not only the average asset class but also the S&P 500. Meanwhile, avoiding the laggard asset classes has been equally important, as the bottom ranked asset class has lost money over the last 26 years.

Both domestic and international equities remain key areas of emphasis, even with domestic equities taking the lead. The two asset classes are separated by a single signal, meaning their positions could swap at a moment’s notice. Additionally, both groups maintain a substantial lead over other asset classes, as international equities hold a 123-signal lead over the third ranked commodities group. With global equities sitting head and shoulders above their peers, investors should continue to focus on US and foreign stocks, as the market’s risk-on positioning remains firmly intact.
One of the most famous sayings around the NDW office is the idea that “assets go in and out of favor like produce at the supermarket”. At its core, this simply means that stocks can naturally rotate as simply as your fruits and veggies at your local grocery store. After all, even the novice chef understands that a lower supply of seasonal berries in the winter means a higher price at checkout… and typically worse taste at the dining room table. This principle is the centerpiece of virtually every one of Dorsey Wright’s strategies—picking your “seasonally accessible” stocks and leaving your “seasonally out-of-favor” on the trading room floor. You’ll see this concept in play in our models, TA scoring system, etc. Since most of us deal primarily with domestic equities, it is easy to think about utilizing momentum solely on the domestic front. However, the practice of finding the “in-season assets” can be put in play around the globe. Today’s feature will discuss utilizing this momentum backed approach on the emerging front, which despite a bit of a downtick off highs, remains a largely productive environment for trend followers.

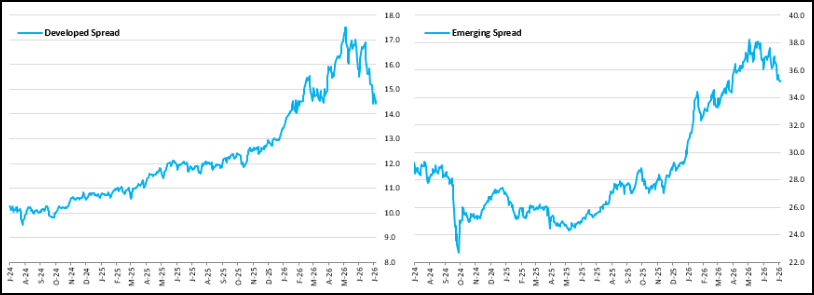
The phrase “productive for trend followers” can be a bit vague. The NDW analyst team uses relative strength (RS) spreads to quantify the difference in strength between high RS names and low RS names. Put simply, a larger spread implies a wider dispersion between winners and losers, which could lead to a more productive environment for momentum backed strategies. We reference these spreads from time to time, most recently discussing the slight contraction of RSSPREAD as some rotation occurred off recent highs. RSSPREAD quantifies the dispersion on the domestic front, but we can run a similar test on the international front. Those values are included below, showing the developed spread on the left and emerging on the right. While both spreads have slipped slightly (signifying less leadership from high RS names) the emerging spread has shown some more resilience in the space. While we won’t focus on it at length today, broader participation has continued to expand on the emerging front, evidenced by a reversal higher by ^BPMUEMRGE@2, signaling more emerging funds trading on PnF buy signals. It is also worth noting that as of 8/18, Domestic Equities managed to overtake International Equities within the NDW DALI rankings, pushing internationals to second. However, both groups still outpace 3rd placed commodities by a wide margin and see buy signal counts meaningfully above their low water marks from 2026. Said more plainly, despite the movement in overall rankings there remains an array of technically strong options within internationals- options we will look to highlight through the rest of this piece.
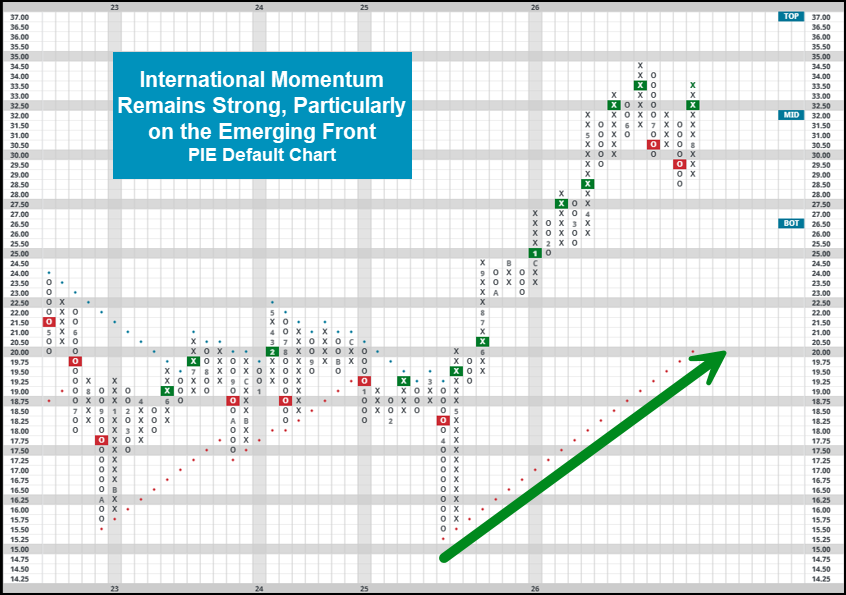
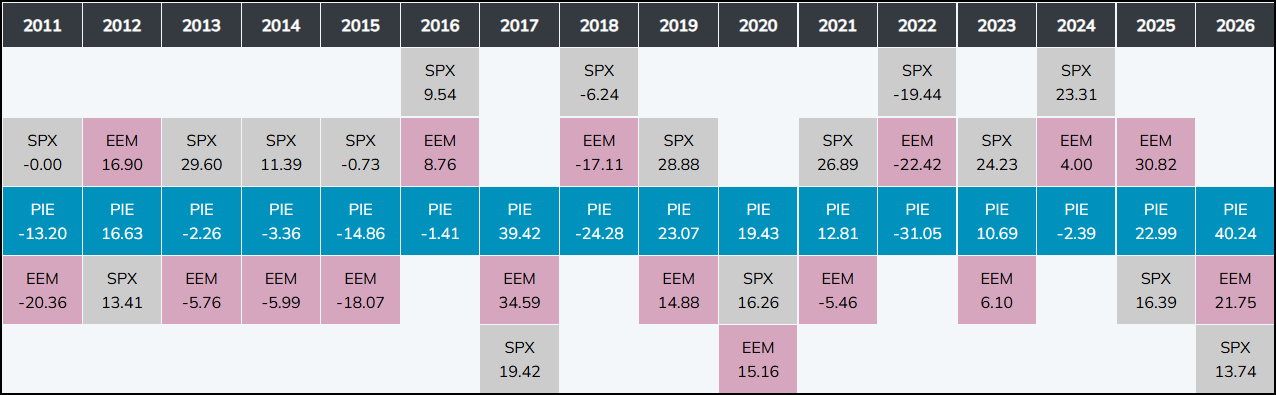
Knowing that a more productive trend following environment exists is one thing—taking advantage of it is another. The Invesco Dorsey Wright Emerging Markets Momentum ETF (PIE) aims to do just that, deploying a relative strength overlay to a basket of emerging market stocks to select those assets that are “in-season.” You can read more about the selection criteria and recent changes in our most recent quarterly update, linked here. PIE holds a near-perfect 5.89 fund score, outpacing broad emerging benchmark EEM by nearly 2-full points (3.95 fund score as of 8/18). PIE has gained ~42% so far this year, roughly double that of EEM (12/31/25 - 8/17/2026).
Diving underneath the hood, we can focus on the differences between the funds and their respective underlying holdings using NDW’s fund comparison tool. Focusing on the country exposure first, we can see that the tactical nature of PIE is leading it to heavily overweight Taiwan (49% vs. 22.5%) and South Africa (5.0% vs. 2.9%). Of course, where you overweight isn’t the only important item—we have found that underweighting specific areas can also be quite important to the long-term success of a strategy. Notable differences include EEM’s ~14% allocation to India, a group which finds itself with no representation within our strategy as of 8/17 as the space is a point of weakness. China (mainland and Hong-Kong) and South Korea are also notable underweights. We can complete the same practice from a sector perspective, where industrial names stand out as a large overweight in PIE vs. EEM. It is also important to emphasize that momentum strategies are self-correcting. If one asset out (under) performs for long enough, it will rotate in (out) of the underlying holdings over time.
Disclosures:
This article is intended for Financial Professional Use Only.
Management and other expenses can have a material impact on performance when compounded over time. Past performance, hypothetical or actual, does not guarantee future results. In all securities trading there is a potential for loss as well as profit. It should not be assumed that recommendations made in the future will be profitable or will equal the performance as shown.
Click here for more information from Invesco on the Invesco Dorsey Wright Emerging Markets Mo ETF (PIE): https://www.invesco.com/us/financial-products/etfs/product-detail?audienceType=Investor&ticker=PIE

Each week the analysts at NDW review and comment on all major asset classes in the global markets. Shown below is the summary or snapshot of the primary technical indicators we follow for multiple areas. Should there be changes mid-week we will certainly bring these to your attention via the report.
| Universe | BP Col & Level (actual) | BP Rev Level | PT Col & Level (actual) | PT Rev Level | HiLo Col & Level (actual) | HiLo Rev Level | 10 Week Col & Level (actual) | 10 Week Rev Level | 30 Week Col & Level (actual) | 30 Week Rev Level |
|---|---|---|---|---|---|---|---|---|---|---|
| ALL |
|
40% |
|
38% |
|
60% |
|
48% |
|
44% |
| NYSE |
|
52% |
|
52% |
|
62% |
|
62% |
|
56% |
| OTC |
|
36% |
|
32% |
|
62% |
|
46% |
|
40% |
| World |
|
40% |
|
46% |
|
|
|
50% |
|
46% |
Remember, these are technical comments only. Just as you must be aware of fundamental data for the stocks we recommend based on technical criteria in the report, so too must you be aware of important data regarding delivery, market moving government releases, and other factors that may influence commodity pricing. We try to limit our technical comments to the most actively traded contracts in advance of delivery, but some contracts trade actively right up to delivery while others taper off well in advance. Be sure you check your dates before trading these contracts. For questions regarding this section or additional coverage of commodities email james.west@nasdaq.com.
Data represented in the table below is through 8/18/26:
| Symbol | Name | Price | PnF Trend | RS Signal | RS Col. | 200 Day MA | Weekly Mom |
|---|---|---|---|---|---|---|---|
| CL/ | Crude Oil Continuous | 84.06 | Positive | Sell | O | 76.95 | + 5W |
| DWACOMMOD | NDW Continuous Commodity Index | 1237.22 | Positive | Buy | X | 1131.93 | + 7W |
| GC/ | Gold Continuous | 4366.00 | Positive | Buy | O | 4491.45 | + 5W |
| HG/ | Copper Continuous | 6.48 | Positive | Sell | X | 5.89 | + 4W |
| ZG/ | Corn (Electronic Day Session) Continuous | 463.25 | Positive | Sell | O | 441.95 | + 7W |

Average Level
14.51
| < - -100 | -100 - -80 | -80 - -60 | -60 - -40 | -40 - -20 | -20 - 0 | 0 - 20 | 20 - 40 | 40 - 60 | 60 - 80 | 80 - 100 | 100 - > |
|---|---|---|---|---|---|---|---|---|---|---|---|
|
Buy signalxlg
|
|||||||||||
|
Buy signaliwm
|
|||||||||||
|
Buy signalIJH
|
|||||||||||
|
Buy signalVOOG
|
|||||||||||
|
Buy signaldia
|
|||||||||||
|
Sell signalQQQ
|
Buy signalefa
|
||||||||||
|
Buy signalicf
|
Sell signalshy
|
Buy signalgld
|
Sell signalfxe
|
||||||||
|
Sell signaltlt
|
Sell signalief
|
Buy signalhyg
|
Sell signalONEQ
|
Buy signalSPY
|
Buy signalrsp
|
Buy signalVOOV
|
|||||
|
Sell signallqd
|
Sell signalagg
|
Buy signaldx/y
|
Sell signalEEM
|
Buy signalijr
|
Buy signaluso
|
Buy signaldvy
|
Sell signalgsg
|
Buy signalgcc
|
|||
| < - -100 | -100 - -80 | -80 - -60 | -60 - -40 | -40 - -20 | -20 - 0 | 0 - 20 | 20 - 40 | 40 - 60 | 60 - 80 | 80 - 100 | 100 - > |
| AGG | iShares US Core Bond ETF |
| USO | United States Oil Fund |
| DIA | SPDR Dow Jones Industrial Average ETF |
| DVY | iShares Dow Jones Select Dividend Index ETF |
| DX/Y | NYCE U.S.Dollar Index Spot |
| EFA | iShares MSCI EAFE ETF |
| FXE | Invesco CurrencyShares Euro Trust |
| GLD | SPDR Gold Trust |
| GSG | iShares S&P GSCI Commodity-Indexed Trust |
| HYG | iShares iBoxx $ High Yield Corporate Bond ETF |
| ICF | iShares Cohen & Steers Realty ETF |
| IEF | iShares Barclays 7-10 Yr. Tres. Bond ETF |
| LQD | iShares iBoxx $ Investment Grade Corp. Bond ETF |
| IJH | iShares S&P 400 MidCap Index Fund |
| ONEQ | Fidelity Nasdaq Composite Index Track |
| QQQ | Invesco QQQ Trust |
| RSP | Invesco S&P 500 Equal Weight ETF |
| IWM | iShares Russell 2000 Index ETF |
| SHY | iShares Barclays 1-3 Year Tres. Bond ETF |
| IJR | iShares S&P 600 SmallCap Index Fund |
| SPY | SPDR S&P 500 Index ETF Trust |
| TLT | iShares Barclays 20+ Year Treasury Bond ETF |
| GCC | WisdomTree Continuous Commodity Index Fund |
| VOOG | Vanguard S&P 500 Growth ETF |
| VOOV | Vanguard S&P 500 Value ETF |
| EEM | iShares MSCI Emerging Markets ETF |
| XLG | Invesco S&P 500 Top 50 ETF |
| Symbol | Company | Sector | Current Price | Action Price | Target | Stop | Notes |
|---|---|---|---|---|---|---|---|
| ZION | Zions Bancorporation | Banks | $70.94 | mid-to-hi 60s | 87 | 55 | 4 for 5'er, top half of favored BANK sector matrix, new RS buy signal, buy on pullback, R-R~2.0, 2.5% yield |
| FR | First Industrial Realty Trust | Real Estate | $62.37 | mid-to-hi 60s | 86 | 59 | 4 for 5'er, top 25% of REAL sector matrix, LT pos peer RS, spread sextuple top, R-R>2.0, 2.9% yield |
| CB | Chubb Ltd | Insurance | $345.29 | mid 340s - mid 360s | 456 | 308 | 4 for 5'er, pos. trend since 2023, LT Mkt RS buy since May '24, Reward to Risk > 4. |
| BFH | Bread Financial Holdings Inc. | Business Products | $111.10 | 100 - 110 | 129 | 89 | 5 for 5'er, top 20% of favored BUSI sector matrix, LT pos peer & mkt RS |
| FITB | Fifth Third Bancorp | Banks | $57.29 | mid to upper 50s | 84 | 46 | 4 for 5'er since March '24, pos. LT Peer RS since March '09, LT pos. trend since Dec. '23. |
| HIG | Hartford Insurance Group Inc/The | Insurance | $138.96 | hi 130s - 140s | 164 | 126 | 5 for 5'er, LT pos peer & mkt RS, bullish catapult, good R-R, 1.65% yield |
| BNY | Bank of New York Mellon Corporation | Banks | $163.93 | low 150s to 160 | 192 | 130 | 5 for 5'er since Sept. '24, top 10% of Banks matrix, LT peer and mkt RS, Pos. trend since Nov. '23. |
| GD | General Dynamics Corporation | Aerospace Airline | $393.48 | 380s - low 390s | 424 | 340 | 4 for 5'er, Pos. ST Peer RS, Pos. LT & ST Mkt RS, Pos. trend and buy signal since June, ATH 7/29. |
| TXRH | Texas Roadhouse, Inc. | Restaurants | $203.39 | 190s - 200s | 262 | 172 | 5 for 5'er, top half of favored REST sector matrix, LT pos peer & mkt RS, good R-R, 1.4% yield |
| GHRS | GH Research Plc | Biomedics/Genetics | $29.75 | 28 - 33 | 46.50 | 24 | 5 for 5'er, LT Mkt. since Feb. '25, top quintile of Bio. matrix, matched chart high on 8/7. |
| GSL | Global Ship Lease Inc. | Transports/Non Air | $43.22 | low 40s | 55 | 35 | 4 for 5'er, favored TRAN sector, LT pos mkt RS, R-R~2.0, 6% yield |
| SXT | Sensient Technologies Corporation | Chemicals | $130.14 | 124 - 132 | 176 | 106 | 4 for 5'er, Pos. LT Peer RS, Top 5 of Chemicals matrix, Pos. Trend since 4/26, ATH on 8/6. |
| BWA | BorgWarner Inc. | Autos and Parts | $67.95 | hi 60s - low 70s | 89 | 57 | 4 for 5'er, top 20% of AUTO sector matrix, triple top, good R-R |
| GE | GE Aerospace | Aerospace Airline | $375.09 | low 360s to hi 380s | 416 | 316 | 3 TA rating since Nov. '22, current 5 for 5'er, LT pos. Mkt and Peer RS, Pos. trend, top third of AERO matrix. |
| MLI | Mueller Industries Inc | Metals Non Ferrous | $64.48 | low-to-mid 60s | 104 | 53 | 5 for 5'er, top third of META sector matrix, LT pos peer & mkt RS, spread triple top, buy on pullback, R-R~3.0 |
| Symbol | Company | Sector | Current Price | Action Price | Target | Stop | Notes |
|---|
| Symbol | Company | Sector | Current Price | Action Price | Target | Stop | Notes |
|---|---|---|---|---|---|---|---|
| MRK | Merck & Co., Inc. | Drugs | $135.17 | 122 - mid 130s | 168 | 106 | MRK has moved into heavily overbought territory. OK to hold here. Raise stop to $120. |
| Comment | |||||||
|---|---|---|---|---|---|---|---|
|
|
|||||||
MLI Mueller Industries Inc R ($64.81) - Metals Non Ferrous - MLI is a 5 for 5'er that ranks in the top third of the non-ferrous metals sector matrix. The stock has been on a market RS buy signal since since 2021 and a peer RS buy signal since 2011. After falling to a sell signal in July, MLY found support in the low $50s for the second time this year and rallied, returning to a buy signal with a spread triple top break at $71, a new all-time high for the stock. MLI has subsequently pulled back to near the middle of its trading band, offering an entry point for long exposure. Positions may be added in the low-to-mid $60s and we will set our initial stop at $53, which would take out two levels of support on MLI's chart. We will use the bullish price objective, $104, as our target price, giving us a reward-to-risk ratio north of 3.0.
| 25 | 26 | ||||||||||||||||||||||||||||
| 71.00 | X | 71.00 | |||||||||||||||||||||||||||
| 70.00 | X | X | X | O | 70.00 | ||||||||||||||||||||||||
| 69.00 | 2 | X | X | O | X | X | O | 8 | O | 69.00 | |||||||||||||||||||
| 68.00 | X | O | X | O | X | O | X | O | X | O | X | O | 68.00 | ||||||||||||||||
| 67.00 | X | O | X | O | X | O | X | O | X | O | X | O | 67.00 | ||||||||||||||||
| 66.00 | X | O | X | 5 | O | O | X | O | X | O | 66.00 | ||||||||||||||||||
| 65.00 | X | O | X | O | X | O | X | O | 65.00 | ||||||||||||||||||||
| 64.00 | X | O | X | O | X | O | X | Mid | 64.00 | ||||||||||||||||||||
| 63.00 | X | O | X | O | X | O | X | 63.00 | |||||||||||||||||||||
| 62.00 | X | O | X | 6 | O | X | 62.00 | ||||||||||||||||||||||
| 61.00 | X | O | X | X | O | X | 61.00 | ||||||||||||||||||||||
| 60.00 | 1 | O | X | O | X | 7 | X | 60.00 | |||||||||||||||||||||
| 59.00 | X | O | X | O | X | O | X | 59.00 | |||||||||||||||||||||
| 58.00 | X | O | X | 3 | X | O | X | 58.00 | |||||||||||||||||||||
| 57.00 | X | O | O | 4 | O | X | 57.00 | ||||||||||||||||||||||
| 56.00 | C | O | X | O | X | 56.00 | |||||||||||||||||||||||
| 55.00 | X | O | X | O | 55.00 | ||||||||||||||||||||||||
| 54.00 | B | O | 54.00 | ||||||||||||||||||||||||||
| 53.00 | X | 53.00 | |||||||||||||||||||||||||||
| 52.00 | A | Bot | 52.00 | ||||||||||||||||||||||||||
| 51.00 | X | 51.00 | |||||||||||||||||||||||||||
| 50.00 | X | 50.00 | |||||||||||||||||||||||||||
| 49.00 | 9 | 49.00 | |||||||||||||||||||||||||||
| 48.00 | X | X | 48.00 | ||||||||||||||||||||||||||
| 47.00 | X | O | X | 47.00 | |||||||||||||||||||||||||
| 46.00 | X | O | X | 46.00 | |||||||||||||||||||||||||
| 45.00 | X | O | 8 | 45.00 | |||||||||||||||||||||||||
| 44.00 | X | O | X | 44.00 | |||||||||||||||||||||||||
| 43.00 | B | O | X | 43.00 | |||||||||||||||||||||||||
| 42.00 | X | O | X | X | 42.00 | ||||||||||||||||||||||||
| 41.00 | X | O | X | O | X | 7 | 41.00 | ||||||||||||||||||||||
| 40.00 | X | C | X | O | X | O | X | X | 40.00 | ||||||||||||||||||||
| 39.00 | X | O | O | X | O | X | O | X | 39.00 | ||||||||||||||||||||
| 38.00 | A | 2 | X | 3 | X | 5 | O | X | 38.00 | ||||||||||||||||||||
| 37.00 | X | O | O | X | O | X | 6 | 37.00 | |||||||||||||||||||||
| 36.00 | X | X | 4 | X | O | X | • | 36.00 | |||||||||||||||||||||
| 35.00 | X | O | X | O | X | O | X | • | 35.00 | ||||||||||||||||||||
| 34.00 | X | O | X | O | O | • | 34.00 | ||||||||||||||||||||||
| 33.00 | X | 9 | • | 33.00 | |||||||||||||||||||||||||
| 25 | 26 |
| ANET Arista Networks Inc ($187.54) - Telephone - Shares of ANET have pushed higher this summer, but action today broke a double bottom at $186 to move back to a sell signal. That said, ANET remains a solid 5 for 5'er after moving into a positive trend at the end of last minute. Despite the sell signal, investors could look to buy here but should monitor for signs of deterioration. Initial support lies at $158 in addition to the bullish support line also at $164. |
| AVGO Broadcom Ltd ($363.89) - Semiconductors - Shares of AVGO broke a double bottom at $372 to move back to a sell signal. Today's move also saw the stock flip back to a negative trend, moving down to hold territory as a 3 for 5'er. Those with positions can hold for now but should watch for further deterioration. Initial support lies closely below at $360. |
| CBRE CBRE Group, Inc. ($154.38) - Real Estate - CBRE pushed higher Wednesday to break a quadruple top at $154 before reaching $156 intraday. This 3 for 5'er moved to a positive trend in July and has been on an RS buy signal against the market since early 2019. The weight of the technical evidence is mixed but improving. Initial support can be seen at $144, which is also the current location of the bullish support line. |
| VIK Viking Holdings Ltd ($92.75) - Leisure - VIK broke a double bottom at $96 to return to a sell signal as shares fell to $93. The move violates the bullish support line, which will drop the stock down to a 3 for 5'er trading in a negative trend. Additionally, VIK now resides within one box of reversing down into Os on its market RS chart. From here, support on the trend chart can be found at $88. |
The option suggestions featured here are pulled from the NDW Options Ideas tool. These are just a sample of the ideas that can be found there. The Options Idea tool contains numerous additional income and speculative plays. It also offers relative strength-based screens targeting the highest (and lowest) relative strength stocks and ETFs that have recently moved counter to their longer-term trend. To access or subscribe to the Options Ideas tool, click here.
Call
J.P. Morgan Chase & Co. (JPM) Nov 20 $355 Call

| Additional Data: | |
| Bid/Ask Spread | 3.62% |
| Delta | 56.76 |
| Gamma | 0.98 |
| Implied Volatility | 22.8% |
| Expiry Date | 93 |
| Earnings Date | 10/13/2026 |
Put
Generac Holdings, Inc. (GNRC) Nov 20 $210 Put

| Additional Data: | |
| Bid/Ask Spread | 5.91% |
| Delta | -43.37 |
| Gamma | 0.67 |
| Implied Volatility | 56.51% |
| Expiry Date | 93 |
| Earnings Date | 10/28/2026 |
Income (Covered Write)
Fortinet Inc. (FTNT) Sep 18 $170 Covered Write

| Additional Data: | |
| Ann. Static Return | 18.37% |
| Bid/Ask Spread | 9.17% |
| Delta | 77.73 |
| Gamma | -1.58 |
| Implied Volatility | 41.97% |
| Expiry Date | 30 |
| Earnings Date | 11/04/2026 |
Daily Equity & Market Analysis
Loading, Please Wait...

