
BPSPX moved to new 2026 highs, but some of the larger high momentum names are still sitting off highs. We discuss the recent developments with today's featured article.
Reports as recently as Monday have talked about the difference in performance between mega-cap options and the “rest” of the broad market. Of course, it is easy to look at performance and visually observe the different numbers, but understanding why performance is different can help contextualize the market landscape for conversations with clients. To put it simply, Dorsey Wright uses the term “participation” to observe what cohort of a given universe is driving markets. Most notably, participation can either be broad (lots of stocks moving in the same direction) or narrow (driven by just a handful of names). Before going further, it is worth noting that performance and participation can diverge… meaning participation can be narrow but markets can improve handedly. These are typically market environments that feel quite fragile- think 2023 where the S&P 500 was driven higher at the hands of seven companies… things were productive but uncomfortably narrow in the moment. A divergence in performance and participation isn’t inherently “wrong” by any means, but can help clue us into market dynamics at any one point in time.
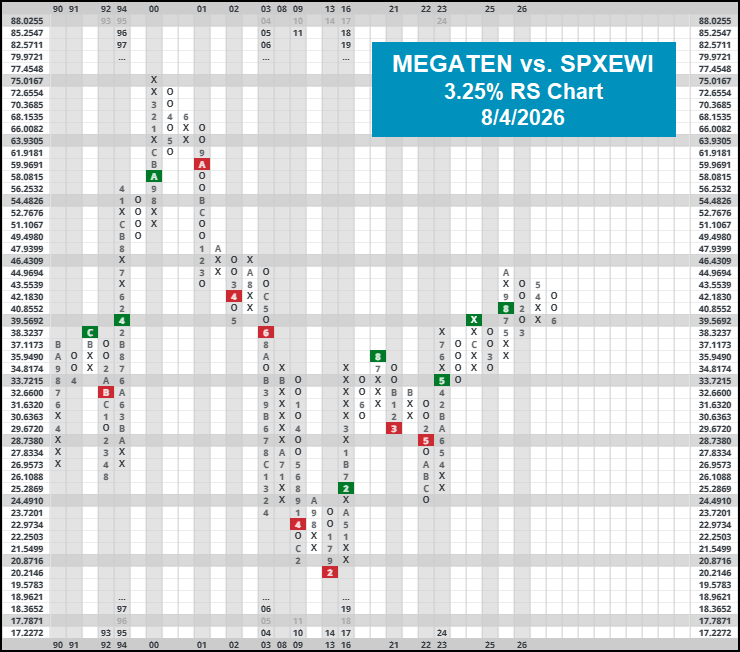
Monday’s report focused on XLG and its recent deterioration on a relative perspective against other areas of the market. To focus more specifically on the largest options, we can observe MEGATEN or MEGAFIVE which focus on the top ten or five largest names by market cap, respectively. MEGATEN (included below) has struggled so far this year, having advanced just over 5% so far in 2026. While the overall technical picture is still defendable, its relative picture leaves much to be desired. A 3.25% RS chart between MEGATEN and the equal weighted S&P 500 shows some relative consolidation between the two, backing off a highpoint of “relative price” since October of 2025. Since those relative highs on 10/29/2025, MEGATEN has gained just 3.5%- far behind the 12% gain for SPX or 16% gain for SPXEWI. This 3.25% chart has been particularly consistent over time, seeing either an RS switching (owning whichever asset sits on an RS buy signal) or a RS reversal strategy (owning whichever asset sits in a column of X’s) best a simple buy and hold portfolio of either asset on its own. Our longer run preference still sits with MEGATEN but the recent relative weakness (outside of the last few days) is certainly worth watching.
We opened this conversation specifically with the idea of participation, which is where we will journey next. ^BPSPX measures the percentage of S&P 500 stocks trading on PnF buy signals on their default chart acting as a decent sign of intermediate term strength for our domestic benchmark. Remember, since our indicator measures the percentage of S&P 500 stocks trading on buy signals, its calculation is completely agnostic of company size. As of 8/4, ^BPSPX sits at 68% signaling that just under seven out of every 10 S&P 500 stocks trades on a buy signal. Note, this is roughly double the metric established at the 2026 lows from March and above those highs established at the start of 2026 All this to say, while waning participation was a bit of a concern throughout Q1 & Q2, it has actually now become a strong point as markets look to get back to all time highs.

As mentioned throughout recent report pieces, there has been a bit of a rotation in leadership momentum is catching onto… evidenced by less high momentum names trading on buy signals. Using data through 8/2, we can construct our own kind of bullish percent calculation using the holdings of MTUM as a universe. Out of the 124 holdings underneath the hood of MTUM, only 51 of the traded on PnF buy signals on their default chart. This equates to roughly 41% of the universe, roughly 25% lower than that of the broader market. This fits in with previous commentary discussed over the last few weeks’ worth of reports that have detailed a rotation away from some of the previous leaders. While the last few days have seen a rather massive upswing from those leaders sending more back to buy signals, keeping tabs on this makeshift bullish percent can be another tool in the toolbox to gauge the strength of high momentum names on market exhales.

