Small caps have perked up quite nicely in 2026. We evaluate the space and where it fits within your portfolio in today's featured article
Markets have struggled to string together a productive start to the third quarter. In fact, of the major asset classes we typically look at, a glance at the overall performance of representatives points towards a bleak outlook for many assets as we roll into August. Risk-on assets, particularly those focused on semiconductors, have moved well off their respective highs signaling a bit of caution for those leading groups from the first half of the year (we discuss more about momentum strategies and their reliance on semis, linked here). Regardless, while the opening to the back half of 2026 has been eye-catching for the wrong reasons, it certainly isn’t to say that the reign of growth focused assets is over, by any means. When we talk about risk-on assets, most of the attention is drawn to the likes of mega-cap technology, the likes of which have been RS leaders for the better part of the last few years. More easily forgotten due to somewhat consistent underperformance have been small caps. While still up a productive 68% since the start of 2023, small cap representative IWM has lagged behind both the S&P 500 (SPX, +93%) and the Nasdaq-100 (NDX, +156%) over that same timeframe. When put this way, it is easy to see why the small cap group has been largely overlooked when it comes to the average advisor’s risk-budget over the last few years- the juice simply hasn’t been worth the squeeze in the space when simply taking excess, focused risk in mega-cap tech has been so rewarding.

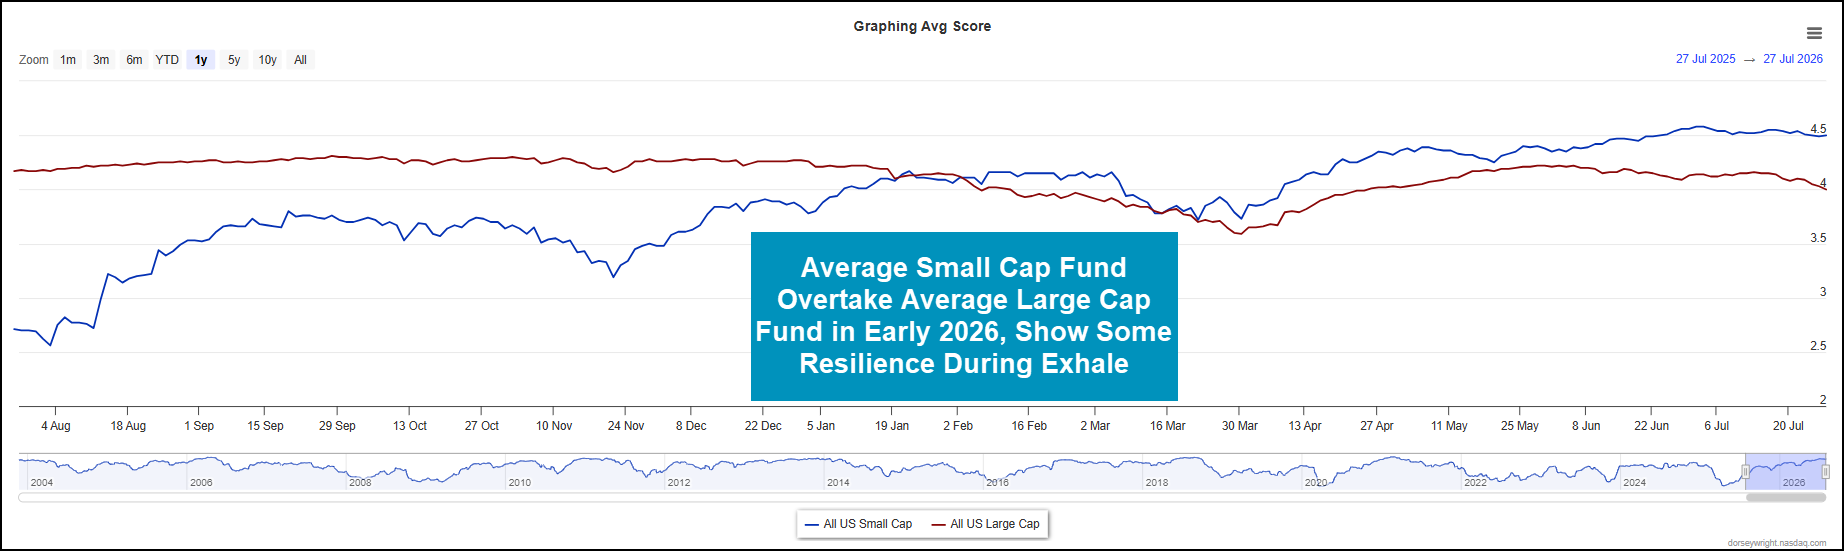
Despite lagging over the past few years, 2026 has been quite kind to the small cap space. The Russell 2000 (RUT) has picked up ~19% so far this year (12/31/25-7/27/2026), roughly double that of the S&P 500 over the same time frame. IWM earns a strong 4.51 fund score, sitting on a string of buy signals after breaking a massive bullish triangle pattern off 2025 tariff tantrum lows. Despite trading off 2025 highs, the fund has yet to reverse down into O’s on its chart, a claim that can’t be made by other large cap focused options which have shown significant consolidation on their default charts. A quick look at the average scores for the all small cap (blue) vs. all large cap (red) shows a rather similar story: small caps have ranked higher than their large cap counterparts for the better part of 2026. Even during this most recent slowdown, the average score for all small caps has shown some relative resiliency vs. the all large cap group. It is certainly worth noting that both groups still score at/above the 4.0 mark, signaling there are still acceptable options across both areas. The main point for you here should be the fact that small caps have shown signs of significant relative strength after a few years of weakness that was a cause for concern.
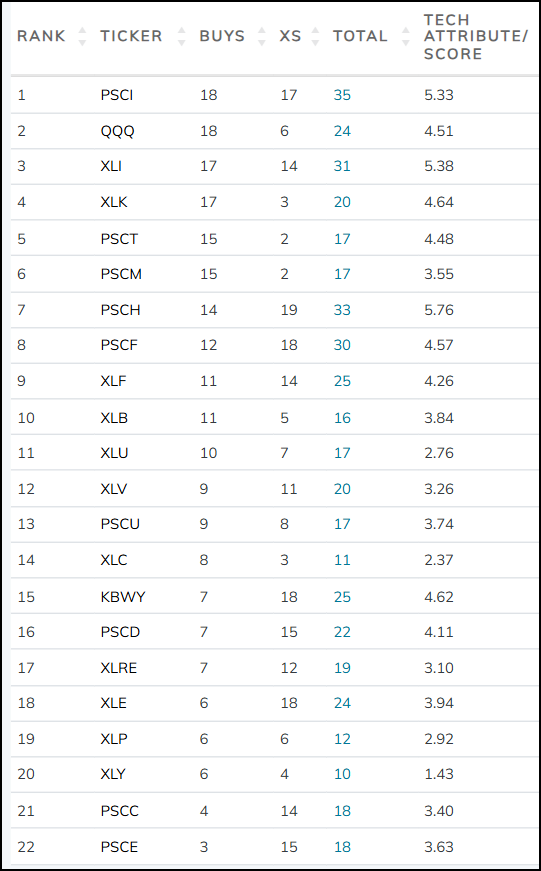
Of course, not all parts of the small cap space are created equal. Just like large cap sector exposure, there is often major dispersion between sectors that you can take advantage of within your portfolio. To measure said dispersion, we can utilize a relative strength matrix to pit small cap sector representatives against each other. To add context, we also included the 11 large cap representatives as well as benchmark QQQ. The rankings are included below as of 7/28. Some high level points include:
- Small cap industrials are the only group to outpace the Nasdaq-100 hurdle. Industrial representatives (PSCI & XLI rank 1st and 3rd within our matrix.
- Smaller biotech strength has led PSCH to outpace XLV by a total of five positions. It remains heavily overbought but is a distinct point of strength to open August.
- Small cap consumer discretionary (PSCD) outpaces XLY by a total of four places, but both rank in the bottom half and should largely be avoided.
- Large cap energy beats small cap energy by an equal four positions as large names with scale have benefited from higher energy prices. Both options rank somewhat poorly heading into August.
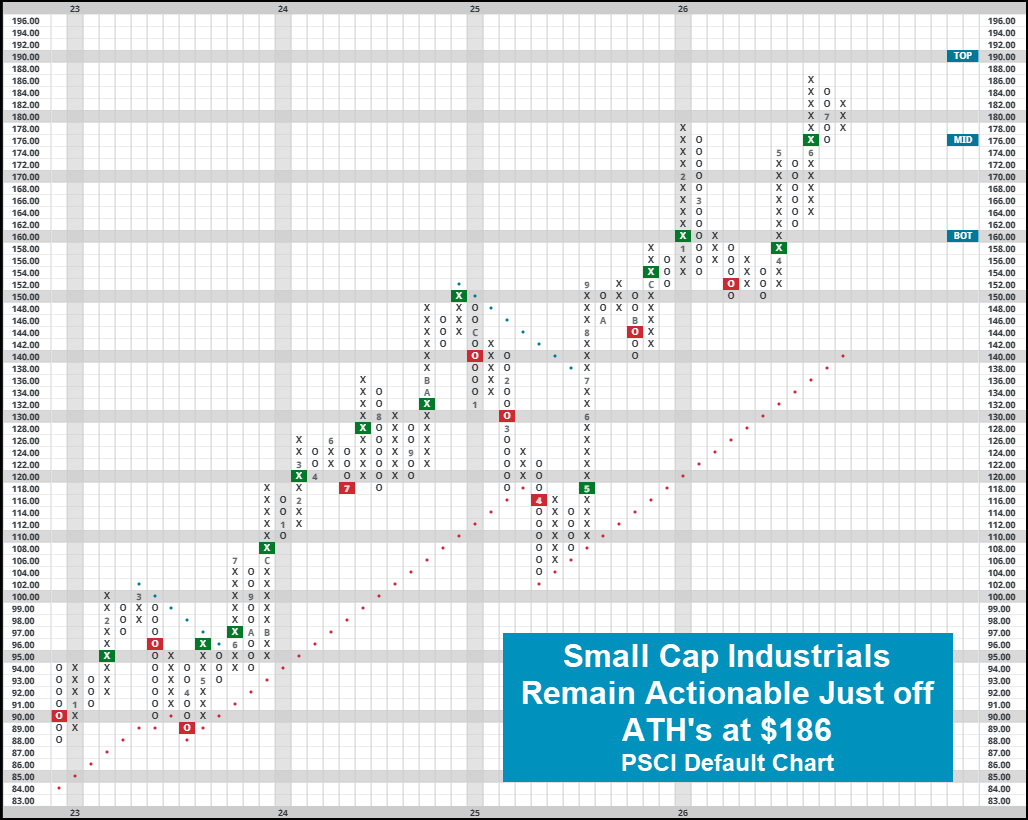
Looking at our highest ranking asset in PSCI, the fund has rallied +19% YTD, bringing with it a pair of consecutive PnF buy signals on its default chart. The fund's strong 5.39 score points to a strong technical posture as it outscores the average small cap fund (4.51) by nearly a full point on the asset class group scores page. PSCI sits in a positive trend, resides on a column of Xs, and has remained on an RS buy signal against the market since 2023. The fund recently completed a double top buy signal at $176 and trades comfortably around its 50-day moving average. Those looking for focused industrials exposure could consider PSCI around here, or look under hood of the fund’s holdings or NDW buy lists for high TA score single stock exposure.