
The idea of being “right” is a slippery slope in the financial advice world. We look at the model builder and discuss how you can avoid the "wrong" things to do for your clients
The idea of being “right” is a slippery slope in the financial advice world. Our compliance officers will be quick to remind us that the correct path forward is largely dependent on every individual’s unique situation… making it downright impossible to give blanket advice nowadays. Regardless, while there isn’t a concrete answer about being “right”, there is typically a much more identifiable “wrong” that you should almost never do in specific scenarios. Today’s feature won’t look to answer the question of the “right” thing to do in the model builder but perhaps give you the tools to simply avoid what is “wrong” for different clients at different parts of their investment life cycle.
To do so, we will explore different levers in the model builder that affect aspects of a return profile for your models. While most of us will get caught up in producing the best returns for clients, it is also important to consider other things like standard deviation, max drawdown, turnover, tax/trade efficiency, sector exposure, etc. Understanding how to fiddle with each one of these layers will help you avoid the ~wrong~ path for your clients. It is worth noting that today’s research discusses the custom modeler, which requires NDW’s highest tier of service. However, its underlying principles (changing sell threshold, eval. frequency, etc.) apply to strategies you might follow outside of the model builder. For more information about a free trial of the model builder or to discuss one of your own models, email miles.clark@nasdaq.com.
To open, we will discuss the four things each model needs to effectively function:
- A number of holdings, which is somewhat self-explanatory
- A “buy window” (highlighted in green) which tells the model where to look to pick up those holdings. Quite often, our holdings and buy window are identical
- A “sell threshold” (highlighted in red) which tells the model how far a holding needs to fall in the rankings before it is sold and replaced
- Evaluation frequency- most often monthly or quarterly, but there are various timeframes available.
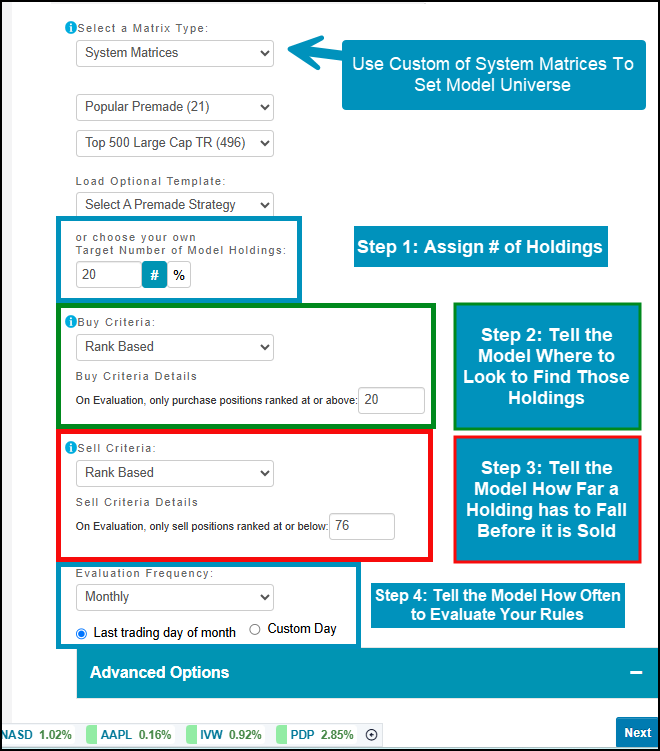
In this case, our starting universe is the top 500 large cap premade matrix. This universe effectively ranks the largest names based on their relative strength and is one of the more popular matrices on the platform. Note we have a multitude of different universes available to you across asset classes.
The holdings count seems like the least influential, but don’t overlook it. Momentum strategies typically prefer fewer holdings, allowing for more focused exposure to high RS names. With that focused exposure comes a more intense return stream. Since the benefits of diversification are limited, portfolio volatility can get more intense than other strategies with more holdings. Remember, this isn’t “right” or “wrong” on its own but will impact which clients will be comfortable with different strategies you build.

We will spend the majority of our time today focusing on line items 3 & 4- changing the sell threshold and evaluation frequency. For reference, our first model below has 20 holdings and evaluates monthly. A common misconception is that you always want to hold the top 20. In this world, we would set our “sell threshold” to 21. In plain English, this model checks monthly to see if any of those holdings have fallen to rank 21 or below. Our model preview is included below- of note are the impressive returns from 6/30/2000- 6/30/2026 (+10.61% p/year for the full period, +25.75% p/year for the last decade). However, also note the turnover, which suggests that the entire portfolio turns over more than 3.25 times per year on average. That’s over 65 trades a year! While the returns might be good…. All that trading is certainly “wrong” for some clients. How might we fix that without damaging the return profile?

You can alter the turnover in two ways: changing the frequency of evaluation or adjusting the sell threshold. Simply changing the evaluation frequency from monthly to quarterly decreases our turnover for the previous model to 217%. It does negatively impact our annual CAGR however, dropping it to 9.2% p/year over our lookback period. We can also explore decreasing our sell threshold, giving holdings more room to run before being sold. From a real-world example, the Patriots didn’t pull Tom Brady from the game after every one of his interceptions… why are we keeping our holdings on such a tight leash?
The next model is a preview of a model that attempts to deploy this idea. Now, instead of selling at rank 21, this model allows a holding to fall to position 76 before being sold. In this case, our returns still drop off our initial “on 20, off 21” model at 9.81% p/year (+25.44% per year over the last decade), but the turnover falls all the way to 170%, roughly 34 trades per year against our original 65. Our drawdown and standard deviation hold steady. The point here is not to claim this way is more “right” than our tighter sell threshold model: some clients might prefer a more sensitive model that is more prone to turnover and whipsaws with the chances of higher returns- others may not. The choice is ultimately yours.

That isn’t to say that we can just decrease our sell threshold without consequence. Eventually, decreasing our sell threshold will have some negative impacts on our returns…. Especially over the near-term as markets seem to move more quickly than they used to. Holding onto positions until they fall to the bottom half (250+) of the rankings yields a (still productive) 21.9% per year over the last decade, roughly 3.5% per year worse than our model which cut the holdings at 76. That isn’t to say that a tighter collar will help in every universe, it more so is an attempt to remind you to not lose sight of one goal in pursuit of another… prioritizing low turnover, or minimizing drawdown, or maximizing returns all impact other aspects of your model, just like hypothetically pulling on one side a triangle impacts the other sides inadvertently.
To avoid rambling, there are still several other ways you can change/impact your return profile. Adding overlays (mainly TA Score, sector maximums, etc) are popular but restrict the model more and can often introduce additional turnover. Cash triggers can help provide additional downside protection but run the risk of “missing” a signal which can prove detrimental to your return stream. Different universes will have different sweet spots worth playing with. More importantly, a major take away here should be that all of our strategies, regardless of sell threshold, outperformed our benchmark SPX over time. While it certainly shouldn’t be misconstrued that the strategy will work all the time, it certainly is worth highlighting that staying committed to an unemotional, tactical strategy can help push the chips in your favor when it comes to exposure over time.

