
Earnings vs. Valuations: What's Driving Sector Performance?
As we move through the second half of the year, a key question for investors is whether sector performance has been driven by improving earnings fundamentals or by expanding valuations. While strong price returns often attract attention, understanding the relationship between price appreciation and earnings growth can provide deeper insight into the sustainability of those gains. By examining changes in P/E ratios across the 11 GICS sectors and the S&P 500, investors can identify which areas of the market are being supported by fundamental earnings growth versus those benefiting primarily from higher valuation multiples. This distinction is particularly important in an environment where leadership remains concentrated in a handful of sectors and valuation dispersion across the market continues to widen.
The price-to-earnings (P/E) ratio is a widely used valuation metric that compares an asset's price to its underlying earnings. Analyzing changes in the P/E ratio can help determine whether performance is being driven by improving fundamentals or by investors assigning a higher valuation multiple.
The chart below decomposes year-to-date performance for the 11 GICS sectors and the S&P 500 into two components: Price Return Growth and Earnings Per Share (EPS) Growth. This framework helps identify whether sector returns have been supported by earnings growth or by changes in valuation. A few notable observations:
- Technology advanced 19.5% year-to-date, while EPS growth climbed 20.2%. Because earnings growth slightly exceeded price appreciation, the sector's P/E ratio contracted by approximately 0.6%, suggesting that strong fundamentals have largely supported the sector's performance.
- Communication Services posted a modest 4.6% price return, while EPS growth rose 13.1%, suggesting earnings growth has outpaced price appreciation and valuations have become more attractive.
- Energy delivered a strong 22.1% price return, but EPS growth increased by just 2.2%, indicating that gains have been driven primarily by multiple expansion rather than earnings growth.

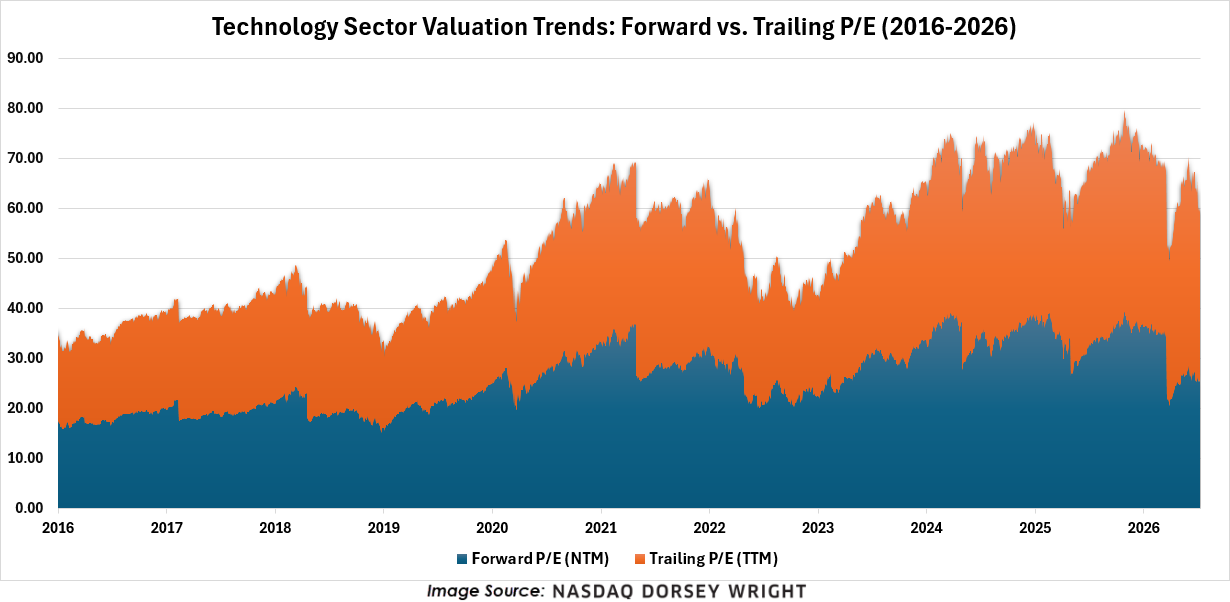
Taking the analysis a step further, we examined technology sector valuations using both trailing twelve-month (TTM) and next twelve-month (NTM) P/E ratios. As shown in the chart below, the sector's forward P/E has trended lower in recent weeks despite continued price strength, suggesting that earnings growth is increasingly supporting the rally. In other words, the sector's performance is being driven more by improving fundamentals than by investors simply assigning higher valuation multiples.
This decline in the forward P/E ratio also points to a moderation in valuation risk, as earnings growth continues to justify the sector's premium valuation. Because forward P/E is based on consensus earnings estimates, a falling multiple alongside rising prices implies that analysts are either revising earnings expectations higher or maintaining strong growth forecasts. Continued optimism surrounding AI-related investment, cloud computing demand, semiconductor earnings growth, and broader technology spending trends appears to be underpinning these expectations and reinforcing the sector's leadership.
If you are looking for exposure, you could consider the State Street Technology Select Sector SPDR ETF (XLK), which provides exposure to stocks in the technology sector. Technology currently ranks first in our DALI sector rankings with 205 signals, beating out the second-place industrials group by 9 signals. XLK maintains a strong fund score of 4.97, with a positive score direction of 1.47. Year-to-date, the fund is up an impressive 29% year-to-date, and 2.87% over the past week. Long exposure can be added here, given the normalization of the 10-week trading band. Initial support is at $178, with additional support at $174.

Overall, the analysis suggests that technology's leadership has been supported by a combination of strong earnings growth and improving fundamental expectations rather than valuation expansion alone. With the sector continuing to rank highly in our DALI framework, forward earnings estimates remaining robust, and valuation multiples showing signs of normalization, technology appears well-positioned to maintain its leadership role as we move through the remainder of the year.
