
The check-a-month strategy involves buying a group of high-yielding, quarterly-dividend-paying stocks with dividend payment dates spread across the quarter so that the client receives a dividend check(s) each month.
The NDW team presents this quarter’s full length “Weight of the Evidence” written report, detailing key technical shifts that occurred over the last quarter as well as important metrics to watch throughout the third quarter and rest of 2026. You can find the article linked HERE. Note, this document is designed to be modular in practice, with each page covering a specific topic in depth. It has also been approved for financial professionals and non-professionals alike.
A webinar recording of Senior Portfolio Manager John Lewis and Senior Research Analyst Miles Clark discussing the report in more detail will be made available in the coming days. CE credit is available.
Breadth in the fixed income market remains narrow as most US core groups now sit near the bottom of the Asset Class Group Scores fixed income rankings. Even non-core groups, like high yield bonds, which had formerly been areas of strength, now sit in the red zone with average scores below 2.5. With that in mind, we thought this would be an opportune time to update our check-a-month strategy. The check-a-month strategy involves buying a group of high-yielding, quarterly-dividend-paying stocks with dividend payment dates spread across the quarter so that the client receives a dividend check(s) each month.
When building a check-a-month portfolio, it is essential to select not only high-yielding stocks but also stocks with a healthy technical picture to better stack the odds of future outperformance in your favor. After all, your client won't be impressed with their 3% yield if the market value of their portfolio drops by 15%. Looking only at dividend yield, we found that there are 104 stocks in the S&P 500 with a dividend yield of 3% or higher. However, when we narrow our search using a technical overlay, we are left with 26 stocks. A list of all the criteria we input in the Security Screener tool is below:
S&P 500 Universe
Price = >$10
Trend = Positive
Technical Attributes = 3+
Dividend Yield > 3%
You will find all 26 names in the table below categorized into three groups based on their usual dividend payment schedule. We've highlighted a couple of our favorites below the table.
Early Quarter Dividend Payout (January, April, July, October)
Mid-Quarter Dividend Payout (February, May, August, November)
Late Quarter Dividend Payout (March, June, September, December)
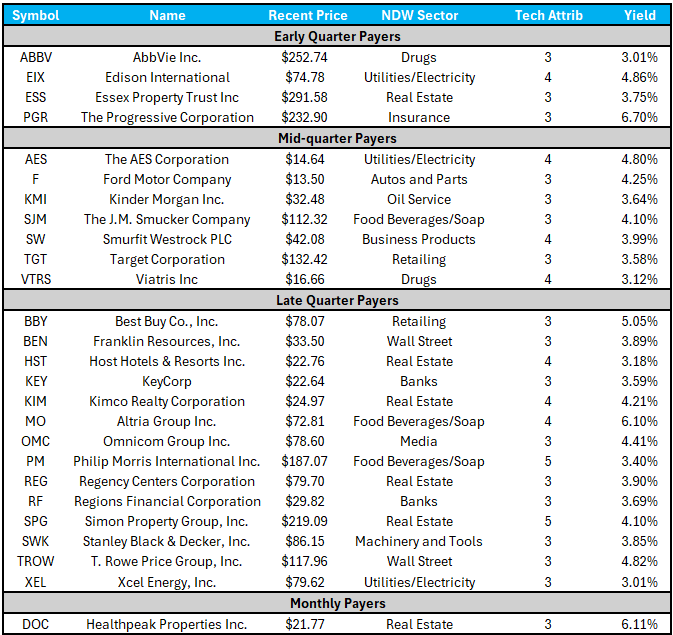
MO Altria Group Inc. ($72.06) - Food Beverages/Soap – MO is a 4 for 5’er that ranks in the top quintile of the food beverages/soap sector matrix. At 6.1%, MO is one of the highest yielding stocks on our list. On its default chart, MO has given three consecutive buy signals and sits one box away from completing a fourth with a spread triple top break at $75. Year-to-date (through 7/8) MO has gained 26.27% on a price return basis.

SPG Simon Property Group, Inc. ($221.01) - Real Estate – SPG is a 5 for 5’er that ranks in the top quintile of the real estate sector matrix. SPG’s 4.1% yield is roughly in-line with the 4.2% average yield for our list. But, SPG has shown durable relative strength as it has been on peer and market RS buy signals since 2021. After giving three consecutive sell signals between March and April, SPG returned to a buy signal when it completed a bearish signal reversal at $194. The stock has continued straight up a single column of Xs since then and currently sits at an all-time high at $228. While it shows no nearby support on its default chart, SPG has found support at $210 and $200 on its $2-per-box chart. Year-to-date, SPG has gained 18.36% on a price return basis.

