Last Friday's down action saw SPX return to O's on its 1% RS chart vs. SPXEWI. Today we talk about the implications of that reversal.
Last Friday (6/5) was ugly for global markets, to say the least. The catalyst for the downside move largely seemed to be the stronger than expected jobs report, ushering back in the idea that good news is bad news for the overall landscape of rates throughout 2026. Markets are still largely convinced that rates in 2026 will either advance, or at the very least stay steady, a stark contrast to the 1-2 rate cuts expected at the start of the year. Adding to the decline was the magnitude of the recent run-up for growth focused assets, particularly semiconductors. All in all, the set-up was ripe for a major exhale that saw semiconductors (SOXX) decline over 10% while major markets (SPX) give back just over 2.50%. The 10.44% decline for SOXX was the 4th worst day in history, followed most recently in March of 2020 (-15% on 3/16/20 and -10.96% on 3/12/20) and 2002 (-10.63%, 10/16/02). While no 10% decline day is “normal” by any stretch of the word, the technical setup for SOXX is still quite strong, with the fund moving back into O’s to a point of old resistance at $530. We touch more on technology’s decline in today’s feature.

A somewhat interesting development to take place as a result of Friday’s action was a reversal back into O’s on a 1% chart between SPX and SPXEWI. In plain language, this suggests that the “average” S&P 500 stock now earns short-term strength against the cap weighted option, a surprising development considering the strength of the larger names coming off 2026 lows. The move marks the first action in favor of SPXEWI since April’s reversal higher as larger names ripped off this year’s lows. It is worth noting that SPX maintains a string of four consecutive buy signals on this chart, suggesting that cap weighted options have maintained their long-term strength since the start of the recent bull market in 2023. While we wouldn’t suggest completely shifting your allocation to favor a more equally weighted position based on this reversal alone, the development certainly does warrant you watch your mega cap positions a bit more cautiously in the event of further declines. It goes without saying that not every reversal is going to lead to a profitable trade… but historically speaking those following an “RS Switching” strategy (owning whichever asset is on a PnF buy signal) or “column switching” (owning whichever asset is in a column of X’s) has led to a return stream that bests owning either SPX or SPXEWI on its own. All that to say, the reversal can be quite telling for what kind of assets are in control of market movement…. But there is perhaps an asterisk that this change comes at the hands of essentially a single day’s exhale rather than sustained leadership from equal weighted assets.

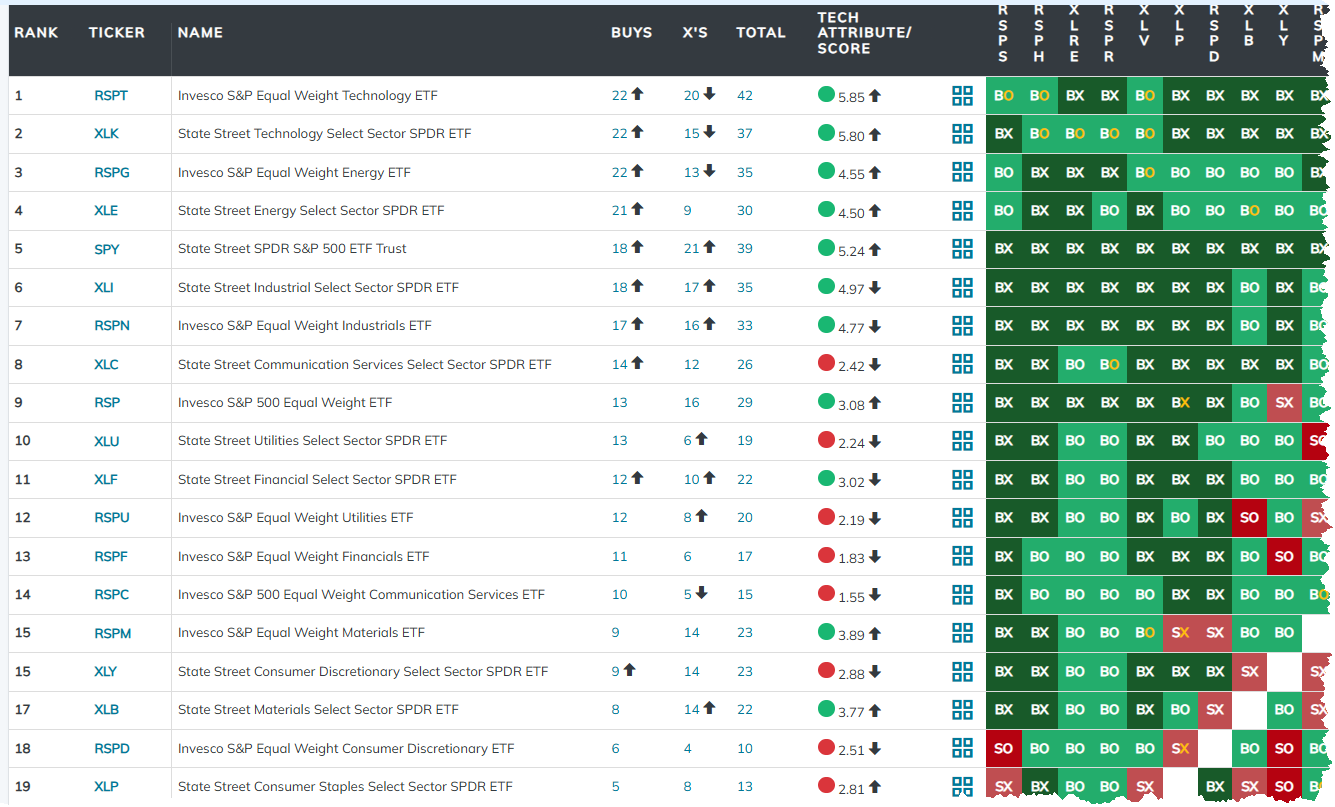
Of course, your portfolio is much more than simple exposure to the S&P 500. There are a multitude of options available to you, spanning across asset classes, size and style perspectives, or sectors. While knowing which option is in control for SPX vs. SPXEWI is helpful, contextualizing each assets strength against other assets across the investment landscape can be quite helpful. Below is a 3.25% matrix pitting SPY & RSP against both cap and equal weighted large cap sector representatives. While the matrix reveals plenty of useful information, perhaps the most interesting is the fact that both RSP and SPY sit in the top 10 of the rankings, signaling high relative strength from both options. All that to say, while equal weighted options have shown some recent relative strength, it certainly isn’t to suggest that larger names have weakened materially- keep this in mind as we rocket to the end of Q2.