
The continued outperformance by small caps during the near-term has brought about notable changes in near-term relative strength, leading to developments within the U.S. Size and Style groups on the Asset Class Group Scores page.
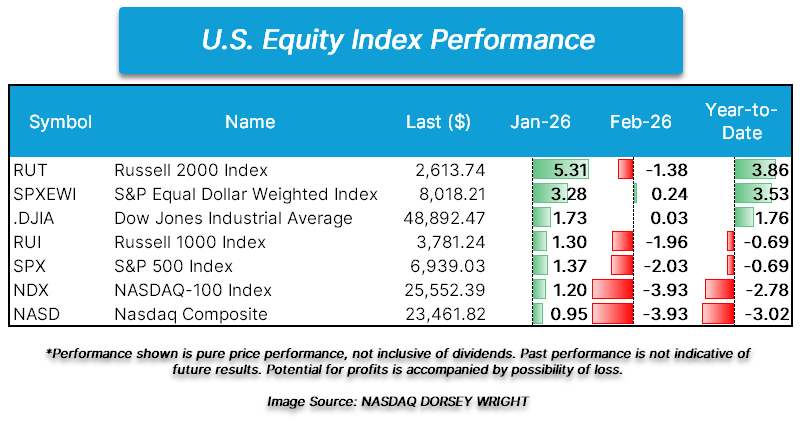
After kicking off 2026 on a hot note with a gain north of 5% in January, small caps, by way of the Russell 2000 Index (RUT), have fallen 1.38% during February’s first week of trading (thru 2/5). Although starting February lower, RUT is still outperforming large cap indices like the S&P 500 (SPX) (fallen 2% in February), Nasdaq-100 (NDX), and Nasdaq Composite (NASD) (both down 3% in February). The continued outperformance by small caps during the near-term has brought about notable changes in near-term relative strength, leading to developments within the U.S. Size and Style groups on the Asset Class Group Scores page.
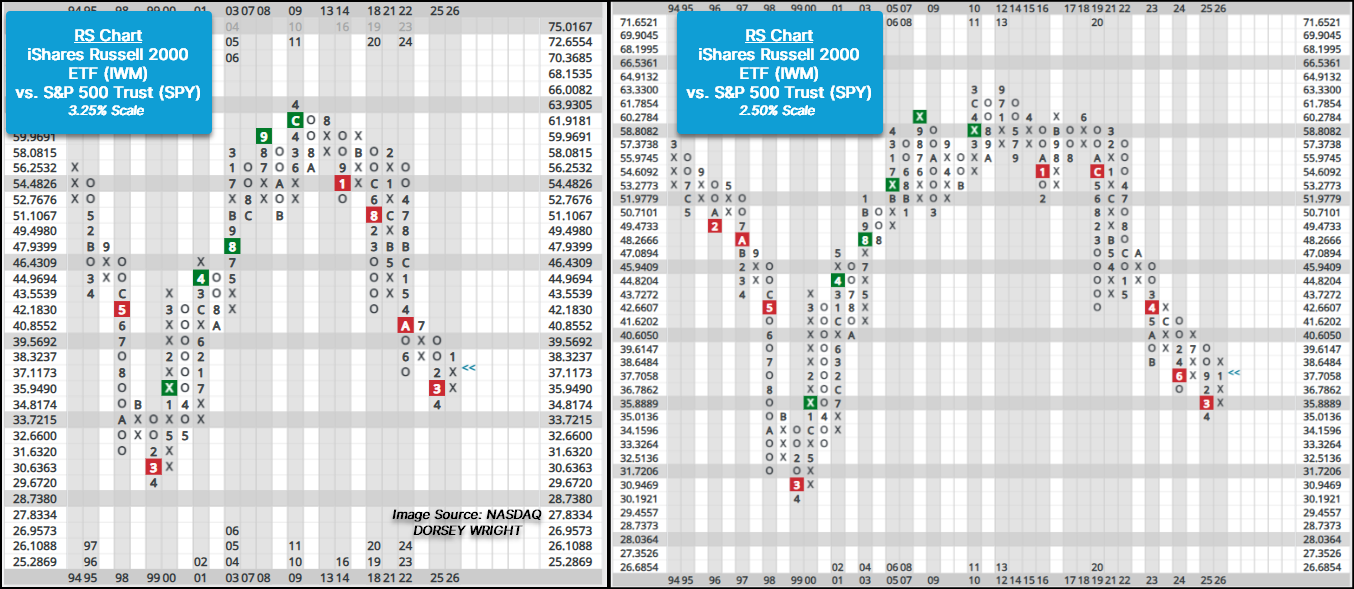
A prime example of the recent positive near-term relative strength by small caps can be seen on the two RS charts between the iShares Russell 2000 ETF (IWM) versus the S&P 500 Trust (SPY) below. On both the longer-term 3.25% and the 2.5% scale RS charts, action in mid-January brought the charts into Xs, signaling near-term outperformance by small caps for the first time since both charts reversed into Os in the latter part of 2024.
While a positive development for small caps in the near-term, many seasoned investors and advisors have witnessed near-term surges in small caps that have failed to develop into a long-term trend of outperformance, such as the one that has been exhibited by large caps for much of the last decade. In the case of the two RS charts below, IWM has been on a relative strength sell signal in the long-term since January 2016.
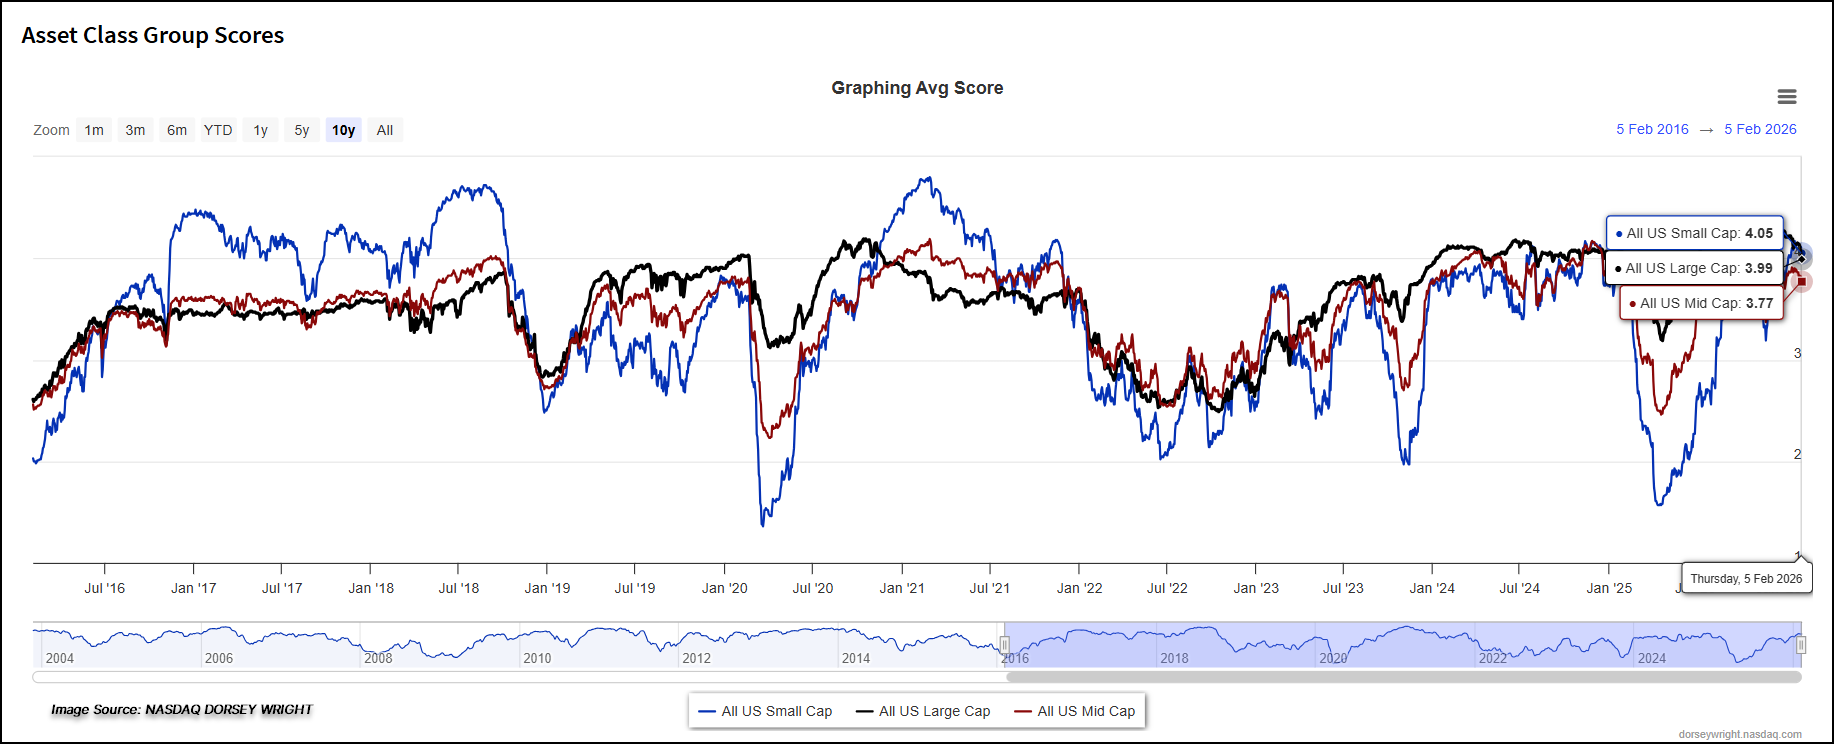
Though the long-term relative strength view shows favoritism to large caps, the Asset Class Group Scores page has highlighted periods in which small and mid caps have seen near-term trending and RS characteristics compete with and better large caps. The line chart below shows the past ten years of group score history for the All US Large, Mid, and Small Cap groups. This week’s action brought All US Small Cap back above All US Large Cap for the first time since the latter part of 2024. For much of 2024 though, small caps were in the sidecar, along for the ride as large caps rallied and provided brief periods of assistance when large caps briefly faltered. The last material period in which large caps scored below their small and mid cap counterparts on the Asset Class Group Scores page was from late 2020 to late 2021. Not only does the chart highlight the ebbs and flows of the market, but it also tells a story of periods in which investors have had to adapt their allocations. Those who have adapted their allocations over the years have changed core or size and style exposure to a more equally weighted approach rather than entirely focused or overweight large caps.
Further evidence of recent developments within large, mid, and small caps can be seen through the U.S. Style View on the Asset Class Group Scores page. Since the end of 2025, Large Cap Value and Blend have fallen below the 4 score threshold, while Small and Mid Cap Value along with Small Cap Blend have seen their group scores rise above 4. The Size and Style snapshots below also highlight developments within the value and growth relationship as well. Notably, all three growth groups are the lowest scoring above the nine size and style groups, while all three value groups score above 4. This highlights that leadership within the small cap rallying has been primarily from the value camp and sectors like energy and staples (as noted in prior reports).
Monitoring shifts in group scores for U.S. Size and Style groups can help adapt allocations in the short-to-intermediate term as well as see the first inkling of changes to leadership due to the more sensitive nature of the fund scoring system. One way to monitor shifts in group score leadership is through the Group Scores Action widget on the Dashboard page. If this widget does not appear on your Dashboard page, it can be added by selecting the blue “+ Widget” in the upper right-hand corner of the Dashboard page.

