
Most Requested Symbols

An update to the +/- 1% daily return SPX volatility study, in addition to reviewing how many days this year have seen daily moves exceeding 2%.
Today's featured stock is Asbury Automotive Group Inc (ABG)
ALGT, CTXS, CWH, CZR, YNDX, LDL, PVH, TSCO, CBOE, & PAHC
Call: QUALCOMM Inc. (QCOM), Put: Intel Corp (INTC), Covered Write: T-Mobile US Inc. (TMUS)
Nasdaq ESG Summit - We invite you to join us for the inaugural Virtual Nasdaq ESG Summit on September 22, 2020, from 11:00 AM to 2:00 PM ET. The Summit will provide compelling views from industry experts with critical ESG knowledge and best practices you need to address short-term and long-term challenges. The event will kick off with a keynote address sure to inspire and provoke conversation around current ESG trends. Following the keynote, registrants can choose from a number of breakout sessions specifically geared towards their interests. For additional information about the summit and to register, click here.
Given the continued domestic equity decline Tuesday, the Bullish Percent for the NYSE ^BPNYSE reversed down into Os from a chart level of 68 down to 62, after reaching 61.02 intraday. Up until today, the BPNYSE had been in a column of Xs since July 17. For those unfamiliar, the BPNYSE measures the percentage of stocks within the NYSE on a Point and Figure buy signal. This reversal lower puts the defensive team back onto the field, indicating a more cautious approach should be taken toward domestic equity exposure in the near-term. For more information or potential strategies around the current position of BPNYSE, please reference our BP Playbook.
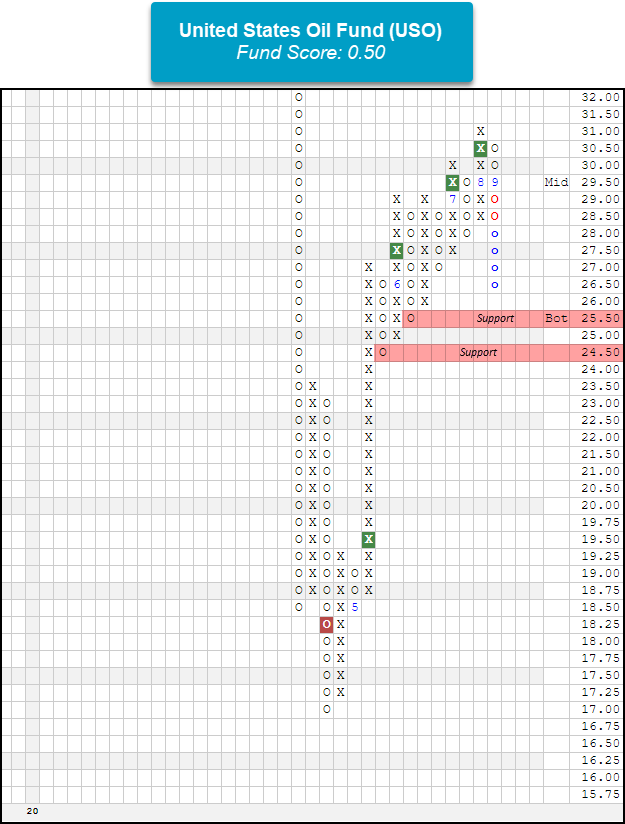
On another note, crude oil prices plummeted lower today with crude oil futures CL/ falling more than 8% during intraday trading after Saudi Arabia signaled that demand recovery was struggling (Bloomberg). The United States Oil Fund USO gave its first sell signal since April when crude oil prices notoriously went into negative territory due to the worldwide shutdown caused by COVID-19. For those unfamiliar, USO uses crude oil futures that extend over various expirations to provide crude oil exposure to investors in an ETF wrapper. USO currently has a fund score of 0.50 with a negative score direction of 1.73, further showing the weakness of crude oil prices. From here, initial support for USO lies at $25.50 with further support at $24.50. With crude oil prices failing to regain their pre-COVID-19 levels, the energy sector continues to be one of the weakest on the DWA platform and currently has an average group score of 2.25 which is well below the acceptable 3.00 mark.

(Source: etf.com)
Domestic equity markets have certainly shown a significant amount of movement thus far through 2020, with the S&P 500 Index SPX undergoing its swiftest decline from all-time highs in March, only to rally over the next few months to print new all-time highs at the beginning of September. Almost immediately after these fresh-highs earlier this month, major domestic equity indexes each saw major pullbacks from overbought territory at the end of last week, which have been largely continued based on intraday trading Tuesday. Perhaps unsurprisingly, this movement has also come with enhanced levels of volatility across major domestic equity indices. There are a variety of ways to measure volatility across broad domestic equities, with the most frequently referenced volatility barometer being the CBOE Volatility Index VIX, which provides the expected volatility of the broader market based on S&P 500 Index options. Another way we measure volatility is through the number of extreme daily moves for SPX, as classified by a gain or loss of 1% or greater. Today, we will examine an update to this SPX volatility study, in addition to reviewing how many days this year have seen daily moves exceeding 2% given the pick-up in volatility.
For the first part of our study, we examine the number of daily moves in which SPX shows a gain or loss of 1% or greater from April 30, 1987, through September 4, 2020. Over this timeframe, there is an average of just over 65 days a year that see an extreme up or down move for the benchmark index. However, there have been significantly more extreme days in 2020, a total of 80 days have seen SPX move +/- 1% or more. Most of these days came earlier in the year, as Q1 saw 31 extreme days, which is tied with 2008 and 2003 for the second most extreme days in the first quarter of any year, behind the 40 extreme days seen in 2009. There were 38 extreme days in Q2 this year, which is the most in Q2 of any year dating back to 1987. However, this volatility lightened thus far through the third quarter, with there being 12 days of extreme moves including the decline on Tuesday. This is below the average of extreme moves in Q3, which sits at just under 16 days. It should be noted that we still have a few weeks left until we hit the fourth quarter, and SPX has already seen 3 out of the 5 trading days in September show a move exceeding 1%, including Tuesday. With that said, we also see that September typically has the least amount of extreme days of any month, at 4.73 days on average. This is quite different than the next month of the year, as we typically see October display the most amount of extreme days at an average of almost 7 days.

If we take a step back on our study and review the number of days where SPX has a gain or loss of 2% or more, we see a similar story. There are typically just over 16 days each year on average that see such a move, and there have been 41 days thus far through Tuesday. Out of these more extreme daily returns, 22 came in Q1 while 17 came in Q2, which are each significantly higher than their quarterly averages of about 4 and 3 days, respectively. Furthermore, the third quarter had not seen any daily moves greater than 2% until last Thursday, and there have now been 2 in the last three days. This still sits below the average of +/- 2% days in Q3, which is just over 4 days.


Four Invesco Model Changes
There are changes to four Invesco models this week, the DWA Global Factor Model GLOBALFACTOR, Invesco Small Cap Sector Model POWERSMALL, the DWA Sector Four Model POWER4, and the Invesco Dynamic Equal Weight Sector Model GUGGEWSECT. .. (Read more)
SSFIXED: Sell SPAB, Buy IBND
Today we have one change to report in the State Street Fixed Income Model SSFIXED. As a refresher, the State Street Fixed Income Model utilizes a relative strength matrix, using total return data, to determine its holdings and will rebalance upon a change, so each position is equally weighted at 25%. The change this week was triggered due to the matrix rank for the SPDR Portfolio Aggregate Bond ETF SPAB deteriorating sufficiently versus its peers in the model universe, warranting its removal from the portfolio. As a result, the SPDR Bloomberg... (Read more)
iShares Feature: Rising & Falling U.S. Dollar Review
There are no changes to any of the iShares models this week. Since peaking in March the US dollar index DX/Y has fallen approximately 10%; as a result, in yesterday’s Daily Equity Report, we updated our US dollar study which shows how various assets perform in rising and falling US dollar environments. As the table below shows, international equities, represent by the iShares EAFE ETF EFA and iShares Emerging Markets ETF EEM, tend to be strong performers in a falling dollar environment.... (Read more)
Average Level
14.41
| AGG | iShares US Core Bond ETF |
| USO | United States Oil Fund |
| DIA | SPDR Dow Jones Industrial Average ETF |
| DVY | iShares Dow Jones Select Dividend Index ETF |
| DX/Y | NYCE U.S.Dollar Index Spot |
| EFA | iShares MSCI EAFE ETF |
| FXE | Invesco CurrencyShares Euro Trust |
| GLD | SPDR Gold Trust |
| GSG | iShares S&P GSCI Commodity-Indexed Trust |
| HYG | iShares iBoxx $ High Yield Corporate Bond ETF |
| ICF | iShares Cohen & Steers Realty ETF |
| IEF | iShares Barclays 7-10 Yr. Tres. Bond ETF |
| LQD | iShares iBoxx $ Investment Grade Corp. Bond ETF |
| IJH | iShares S&P 400 MidCap Index Fund |
| ONEQ | Fidelity Nasdaq Composite Index Track |
| QQQ | Invesco QQQ Trust |
| RSP | Invesco S&P 500 Equal Weight ETF |
| IWM | iShares Russell 2000 Index ETF |
| SHY | iShares Barclays 1-3 Year Tres. Bond ETF |
| IJR | iShares S&P 600 SmallCap Index Fund |
| SPY | SPDR S&P 500 Index ETF Trust |
| TLT | iShares Barclays 20+ Year Treasury Bond ETF |
| GCC | WisdomTree Continuous Commodity Index Fund |
| VOOG | Vanguard S&P 500 Growth ETF |
| VOOV | Vanguard S&P 500 Value ETF |
| EEM | iShares MSCI Emerging Markets ETF |
| XLG | Invesco S&P 500 Top 50 ETF |

| Symbol | Company | Sector | Current Price | Action Price | Target | Stop | Notes |
|---|---|---|---|---|---|---|---|
| PLD | ProLogis | Real Estate | $100.76 | hi 90s - mid 100s | 116 | 87 | 5 for 5'er, top third of REAL sector matrix, spread triple top, pos monthly mom flip, 2.2% yield |
| ROK | Rockwell Automation, Inc. | Electronics | $228.25 | 220s - 230s | 274 | 200 | 5 for 5'er, top 33% of ELEC sector matrix, LT pos mkt RS, spread triple top, 1.8% yield |
| ON | On Semiconductor Corp. | Semiconductors | $22.68 | low 20s | 36.50 | 18 | 5 for 5'er, consec buy signals, top 25% of fav DWASEMI, pos mon mom |
| ALGN | Align Technology, Inc. | Healthcare | $309.00 | low 300s to mid 310s | 392 | 248 | 5 for 5'er, top 25% of DWAHEAL, pos mon mom, bullish triangle pattern |
| PENN | Penn National Gaming Inc | Gaming | $54.15 | lot-to-mid 50s | 76 | 45 | 5 for 5'er, #1 of 12 names in favored GAME sector matrix, pullback from ATH, pot covered write |
| ABG | Asbury Automotive Group Inc. | Retailing | $106.32 | low 100s to upper 110s | 147 | 86 | 5 for 5'er, consec buy signals, pullback from 52 week high, pos mon mom, top 25% of fav DWARETA |
| Symbol | Company | Sector | Current Price | Action Price | Target | Stop | Notes |
|---|---|---|---|---|---|---|---|
| THS | TreeHouse Foods, Inc. | Food Beverages/Soap | $42.82 | low to mid 40s | 36 | 53 | 0 for 5'er, consec sell signals, LT market RS sell signal, bottom quartile of DWAFOOD |
| Symbol | Company | Sector | Current Price | Action Price | Target | Stop | Notes |
|---|---|---|---|---|---|---|---|
| COLB | Columbia Banking System, Inc. | Banks | $27.87 | 28 - 30 | 46 | 23 | See follow comment below. |
| AMP | Ameriprise Financial | Finance | $156.54 | hi 150s - hi 160s | 188 | 136 | See follow comment below. |
| Comment |
|---|
| CMG Chipotle Mexican Grill 'A' R ($1,317.85) - Restaurants - Raise stop to 1056, which would take out multiple levels of support on the chart |
| BILL Bill.com Holdings, Inc. R ($85.54) - Business Products - BILL hit out stop on Friday. We will exit on today's bounce. |
| SQ Square Inc R ($144.39) - Software - SQ hit our stop on Friday. We will exit on today's bounce. |
| COLB Columbia Banking System, Inc. R ($26.63) - Banks - COLB moved to a sell signal and is now trading in a negative trend. No new positions here. We will maintain our $23 stop. |
| AMP Ameriprise Financial R ($150.64) - Finance - AMP moved to a sell signal with today's action. No new positions here. We will abide by our $136 stop. |
ABG Asbury Automotive Group Inc. R ($108.67) - Retailing - ABG is a 5 for 5’er that ranks within the top quartile of the favored retailing sector RS matrix. This stock has given a total of five consecutive buy signals, confirming that demand is in control. After reaching a new 52 week high at $112 in August, ABG has started to consolidate on its chart. From here, a move to $112 would complete a bullish triangle pattern. Okay to add new exposure in the low 100s to upper 110s. We will set our initial stop at $86 and will use a modified price objective of $147 as our near-term price target.
| 112.00 | • | X | 112.00 | ||||||||||||||||||||||||||||||||||||||||||||||||||
| 110.00 | • | X | O | 9 | 110.00 | ||||||||||||||||||||||||||||||||||||||||||||||||
| 108.00 | • | X | X | O | X | O | 108.00 | ||||||||||||||||||||||||||||||||||||||||||||||
| 106.00 | • | X | O | X | O | X | O | 106.00 | |||||||||||||||||||||||||||||||||||||||||||||
| 104.00 | • | X | O | X | O | X | O | 104.00 | |||||||||||||||||||||||||||||||||||||||||||||
| 102.00 | • | X | X | O | 8 | O | X | 102.00 | |||||||||||||||||||||||||||||||||||||||||||||
| 100.00 | X | • | X | O | X | O | X | O | Mid | 100.00 | |||||||||||||||||||||||||||||||||||||||||||
| 99.00 | O | X | O | • | X | O | X | O | X | 99.00 | |||||||||||||||||||||||||||||||||||||||||||
| 98.00 | O | X | O | • | X | O | X | O | 98.00 | ||||||||||||||||||||||||||||||||||||||||||||
| 97.00 | O | X | O | • | X | O | 97.00 | ||||||||||||||||||||||||||||||||||||||||||||||
| 96.00 | O | X | O | • | X | 96.00 | |||||||||||||||||||||||||||||||||||||||||||||||
| 95.00 | O | X | O | X | • | X | 95.00 | ||||||||||||||||||||||||||||||||||||||||||||||
| 94.00 | O | X | O | X | O | • | X | 94.00 | |||||||||||||||||||||||||||||||||||||||||||||
| 93.00 | O | O | X | O | • | X | 93.00 | ||||||||||||||||||||||||||||||||||||||||||||||
| 92.00 | O | X | O | • | X | X | 92.00 | ||||||||||||||||||||||||||||||||||||||||||||||
| 91.00 | O | X | O | • | X | O | X | 91.00 | |||||||||||||||||||||||||||||||||||||||||||||
| 90.00 | O | X | O | • | X | O | X | 90.00 | |||||||||||||||||||||||||||||||||||||||||||||
| 89.00 | O | 3 | O | • | X | O | X | 89.00 | |||||||||||||||||||||||||||||||||||||||||||||
| 88.00 | O | X | O | • | X | O | X | 88.00 | |||||||||||||||||||||||||||||||||||||||||||||
| 87.00 | O | X | O | • | X | X | O | 87.00 | |||||||||||||||||||||||||||||||||||||||||||||
| 86.00 | O | O | • | X | O | X | 86.00 | ||||||||||||||||||||||||||||||||||||||||||||||
| 85.00 | O | • | X | O | X | 85.00 | |||||||||||||||||||||||||||||||||||||||||||||||
| 84.00 | O | • | X | O | X | 84.00 | |||||||||||||||||||||||||||||||||||||||||||||||
| 83.00 | O | • | X | O | X | X | 83.00 | ||||||||||||||||||||||||||||||||||||||||||||||
| 82.00 | O | • | X | O | X | O | X | 82.00 | |||||||||||||||||||||||||||||||||||||||||||||
| 81.00 | O | • | X | X | O | X | O | X | 81.00 | ||||||||||||||||||||||||||||||||||||||||||||
| 80.00 | O | • | X | O | X | O | X | O | X | 80.00 | |||||||||||||||||||||||||||||||||||||||||||
| 79.00 | O | • | X | O | X | O | X | O | X | X | 79.00 | ||||||||||||||||||||||||||||||||||||||||||
| 78.00 | O | X | O | X | O | X | X | O | X | O | X | 78.00 | |||||||||||||||||||||||||||||||||||||||||
| 77.00 | O | X | O | X | O | X | O | X | O | X | X | O | X | • | 77.00 | ||||||||||||||||||||||||||||||||||||||
| 76.00 | O | X | O | X | O | X | O | X | O | X | O | X | 7 | • | 76.00 | ||||||||||||||||||||||||||||||||||||||
| 75.00 | O | X | O | X | O | X | O | X | O | X | O | X | • | 75.00 | |||||||||||||||||||||||||||||||||||||||
| 74.00 | O | X | X | O | X | O | X | O | X | O | X | O | X | • | Bot | 74.00 | |||||||||||||||||||||||||||||||||||||
| 73.00 | O | X | O | X | O | X | O | O | O | O | X | • | 73.00 | ||||||||||||||||||||||||||||||||||||||||
| 72.00 | O | X | O | X | 6 | O | • | 72.00 | |||||||||||||||||||||||||||||||||||||||||||||
| 71.00 | O | X | X | O | • | 71.00 | |||||||||||||||||||||||||||||||||||||||||||||||
| 70.00 | O | X | X | O | X | • | 70.00 | ||||||||||||||||||||||||||||||||||||||||||||||
| 69.00 | O | X | O | X | O | X | X | • | 69.00 | ||||||||||||||||||||||||||||||||||||||||||||
| 68.00 | O | X | O | X | O | X | O | X | • | 68.00 | |||||||||||||||||||||||||||||||||||||||||||
| 67.00 | O | X | O | X | O | X | O | X | • | 67.00 | |||||||||||||||||||||||||||||||||||||||||||
| 66.00 | O | X | O | X | O | X | O | X | • | 66.00 | |||||||||||||||||||||||||||||||||||||||||||
| 65.00 | O | X | 5 | X | O | X | O | X | • | 65.00 | |||||||||||||||||||||||||||||||||||||||||||
| 64.00 | O | X | O | X | O | O | X | • | 64.00 | ||||||||||||||||||||||||||||||||||||||||||||
| 63.00 | O | X | O | O | X | • | 63.00 | ||||||||||||||||||||||||||||||||||||||||||||||
| 62.00 | O | X | X | X | O | X | • | 62.00 | |||||||||||||||||||||||||||||||||||||||||||||
| 61.00 | O | X | O | X | O | X | O | X | • | 61.00 | |||||||||||||||||||||||||||||||||||||||||||
| 60.00 | O | X | O | X | O | X | X | O | X | • | 60.00 | ||||||||||||||||||||||||||||||||||||||||||
| 59.00 | O | X | O | X | O | X | O | X | O | X | • | 59.00 | |||||||||||||||||||||||||||||||||||||||||
| 58.00 | O | X | O | X | O | X | O | X | X | O | X | • | 58.00 | ||||||||||||||||||||||||||||||||||||||||
| 57.00 | O | X | O | X | X | O | X | O | X | O | X | O | • | 57.00 | |||||||||||||||||||||||||||||||||||||||
| 56.00 | O | X | O | X | O | X | O | O | X | O | X | • | 56.00 | ||||||||||||||||||||||||||||||||||||||||
| 55.00 | O | X | O | X | O | X | O | X | O | X | • | 55.00 | |||||||||||||||||||||||||||||||||||||||||
| 54.00 | O | X | O | O | X | O | X | O | X | • | 54.00 | ||||||||||||||||||||||||||||||||||||||||||
| 53.00 | O | X | X | 4 | X | O | X | O | X | • | 53.00 | ||||||||||||||||||||||||||||||||||||||||||
| 52.00 | O | X | O | X | O | X | O | O | X | • | 52.00 | ||||||||||||||||||||||||||||||||||||||||||
| 51.00 | O | X | O | X | O | X | O | • | 51.00 | ||||||||||||||||||||||||||||||||||||||||||||
| 50.00 | O | X | X | O | X | O | X | • | 50.00 | ||||||||||||||||||||||||||||||||||||||||||||
| 49.00 | O | X | O | X | O | X | O | X | X | • | 49.00 | ||||||||||||||||||||||||||||||||||||||||||
| 48.00 | O | X | O | X | O | X | O | X | O | X | • | 48.00 | |||||||||||||||||||||||||||||||||||||||||
| 47.00 | O | X | O | X | O | X | O | X | O | X | • | 47.00 | |||||||||||||||||||||||||||||||||||||||||
| 46.00 | O | X | O | X | O | O | O | X | • | 46.00 | |||||||||||||||||||||||||||||||||||||||||||
| 45.00 | O | X | O | X | O | X | • | 45.00 | |||||||||||||||||||||||||||||||||||||||||||||
| 44.00 | O | X | O | X | O | X | • | 44.00 | |||||||||||||||||||||||||||||||||||||||||||||
| 43.00 | O | O | X | O | X | • | 43.00 | ||||||||||||||||||||||||||||||||||||||||||||||
| 42.00 | O | X | O | • | 42.00 | ||||||||||||||||||||||||||||||||||||||||||||||||
| 41.00 | O | X | • | 41.00 | |||||||||||||||||||||||||||||||||||||||||||||||||
| 40.00 | O | 40.00 |
| ALGT Allegiant Travel Company ($137.08) - Aerospace Airline - ALGT broke a double top at $138, marking the fourth consecutive buy signal on the chart. This stock is a 3 for 5’er within the favored aerospace airline sector that has experienced three weeks of positive weekly momentum and two months of positive monthly momentum. At current levels, ALGT is testing its recent highwatermark. From here, support sits at $130. Note ALGT provides a yield of 3.75%. |
| CBOE CBOE Global Markets Inc. ($90.55) - Wall Street - CBOE broke a double bottom at $88 on Tuesday, marking the second consecutive sell signal on the chart. CBOE is an unacceptable 0 for 5’er within the unfavored Wall Street sector that ranks dead last in the sector stock RS matrix. From here, further support sits at $85. Avoid as supply is in control. |
| CTXS Citrix Systems, Inc. ($138.50) - Software - CTXS broke a spread quadruple bottom at $134 and is now trading in a negative trend. As a result, CTXS is a weak 2 for 5’er that ranks 102nd out of 113 names in the software sector RS matrix. Supply is in control. Avoid. Further support sits at $116. |
| CWH Camping World Holdings Inc ($34.90) - Retailing - CWH returned to a buy signal on Tuesday with a double top breakout at $34 before moving higher to $35. This stock is a 3 for 5’er within the favored retailing sector that moved into a positive trend in May. Demand is in control. From here, support sits at $29. |
| CZR Caesars Entertainment Inc. ($51.46) - Gaming - CZR broke a double top at $51, marking the stock’s fourth consecutive buy signal. CZR is a 3 for 5’er that has experienced two months of positive monthly momentum. From here, support sits at $47, while CZR faces overhead resistance at $70. |
| LDL Lydall Inc ($17.98) - Machinery and Tools - LDL moved to a sell signal today with a double bottom break at $18. The long-term picture remains intact as LDL is a 5 for 5’er that ranks 1st out of 65 names in the favored machinery and tools sector. No new positions here. Those long may continue to hold. The next level of support sits at $16. |
| PAHC Phibro Animal Health Corp ($18.78) - Drugs - PAHC broke a double bottom at $18.50, marking the third consecutive sell signal on the chart. PAHC is an unacceptable 0 for 5’er as it does not have any trending or relative strength characteristics in its favor at this time. Additionally, PAHC has been trading in a negative trend since November 2018 and has experienced two months of negative monthly momentum. Avoid. From here, further support sits at $17.50. |
| PVH Phillips-Van Heusen Corporation ($66.67) - Textiles/Apparel - PVH broke a double top at $65 before moving higher to $67. This stock is a 3 for 5’er that is trading in a positive trend. Additionally, monthly momentum has been positive for two months, suggesting the potential for higher prices. From here, support sits at $61. |
| TSCO Tractor Supply Company ($137.28) - Retailing - After forming a double top at $154, TSCO moved to a sell signal at $140 before moving lower to $138. This action sets the chart up for a potential shakeout pattern. The action point of the shakeout would be triggered with a reversal up into Xs, and the shakeout would complete with a triple top breakout at $156. TSCO is a 5 for 5’er within the favored retailing sector. Okay to play the pattern on the reversal up or upon completion. |
| YNDX Yandex NV ($61.84) - Internet - YNDX moved to a sell signal on Tuesday with a double bottom break at $63 before moving lower to $62. Today’s move marks the first sell signal on the chart since March of this year. Although this is considered a negative for the stock, the long-term picture for YNDX is still intact as it remains a 5 for 5’er in the internet sector. Those long can look to $57 for the next level of support. |
| Name | Option Symbol | Action | Stop Loss |
|---|---|---|---|
| QUALCOMM Incorporated - $109.77 | QCOM2115A100 | Buy the January 100.00 calls at 17.05 | 104.00 |
| Name | Option | Action |
|---|---|---|
| StoneCo Ltd. Class A ( STNE) | Jan. 50.00 Calls | Stopped at 48.00 (CP: 49.60) |
| Name | Option Symbol | Action | Stop Loss |
|---|---|---|---|
| Intel Corporation - $48.91 | INTC2115M55 | Buy the January 55.00 puts at 8.50 | 53.00 |
| Name | Option | Action |
|---|---|---|
| ConocoPhillips (COP) | Nov. 45.00 Puts | Raise the option stop loss to 9.05 (CP: 11.05) |
| Walgreens Boots Alliance Inc. (WBA) | Jan. 42.50 Puts | Raise the option stop loss to 5.55 (CP: 7.55) |
| Gilead Sciences, Inc. (GILD) | Nov. 70.00 Puts | Raise the option stop loss to 5.90 (CP: 7.90) |
| Name | Option Sym. | Call to Sell | Call Price | Investment for 500 Shares | Annual Called Rtn. | Annual Static Rtn. | Downside Protection |
|---|---|---|---|---|---|---|---|
| T-Mobile US Inc. $114.29 | TMUS2115A115 | Jan. 115.00 | 7.15 | $52,803.60 | 22.18% | 15.98% | 5.34% |
| Name | Action |
|---|---|
| Wendy's Company (WEN) - 21.58 | Sell the November 22.00 Calls. |
| PulteGroup, Inc. (PHM) - 43.21 | Sell the January 50.00 Calls. |
| Bank of America (BAC) - 26.54 | Sell the December 27.00 Calls. |
| Ally Financial Inc. (ALLY) - 25.24 | Sell the December 24.00 Calls. |
| Aptiv PLC (APTV) - 86.21 | Sell the November 87.50 Calls. |
| The Walt Disney Company (DIS) - 131.99 | Sell the January 140.00 Calls. |
| Barrick Gold Corporation (GOLD) - 29.05 | Sell the January 31.00 Calls. |
| Dynatrace, Inc. (DT) - 39.99 | Sell the December 45.00 Calls. |
| Name | Covered Write |
|---|---|
| Canadian Natural Resources Ltd. ( CNQ - 19.73 ) | December 21.00 covered write. |
| Microchip Technology Incorporated ( MCHP - 108.15 ) | November 115.00 covered write. |
| Citigroup, Inc. ( C - 52.52 ) | December 57.50 covered write. |
Daily Equity & Market Analysis
Loading, Please Wait...
