| Welcome: |
|
| Lesson 1: |
Part 3: Support Lines |
One of the most important guides
you have in Point and Figure charting is the Bullish Support
or Bearish Resistance Lines. It is uncanny how a stock will follow
along either the Bullish Support or Bearish Resistance Line.
They are like brick walls.
A stock is bullish if trading above the bullish support line
and bearish if trading below the bearish resistance line.
|
Bullish Support Line.
Serves as a guide for the up
trend of a stock.
Has a habit of acting like a brick wall. Stocks will often come
right down to the bullish support line and then bounce off.
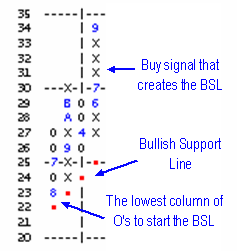
To draw the support line, you must first have a buy signal off
the bottom. Go to the lowest column of O's and begin drawing
a line up at a 45 degree angle. The angle will always be a 45
degree angle.
|

|
| Once a stock has formed a base of accumulation
and gives the first buy signal, we go to the lowest column of
O's in the chart pattern and begin drawing a trend line. Starting
with the box directly under that column of O's and diagonally
connecting each box upward in a 45 degree angle. This method,
unlike bar charts, never connects prices - the angle of the Bullish
Support Line (also known as the BSL) is always 45 degrees. |

|
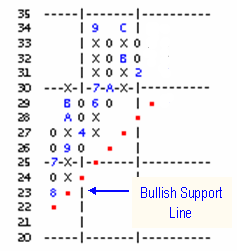
| When the stock penetrates the trend line (the BSL)
it is a critical event and a strong sign to sell the stock. To
qualify as a penetration, the trend line must be violated and not
just touched. There is no such thing as the line being a little
penetrated. It is or it isn't. Below, the stock maintained the
trend line all the way up from $23 to $34. Soon after, supply took control of the
stock. When the stock hit $29, it violated the Bullish Support Line.
A trend change is when the trend chart
turns from negative to positive or vice versa. This correlates
to the Bullish Support or Bearish Resistance Line. As long as
the stock trades above the BSL it is a positive trend but once
it pierces that line the trend becomes negative. We will go over
buy and sell signals in Lesson two. (We will typically give a stock the benefit
of the doubt if it gives a sell signal while it is trading close
to the Bullish Support Line.) |

|
Once a stock is well above
the long term bullish support line, short term trend lines can
be drawn. When a stock rises significantly above this trend line
and gives more buy signals, you can go to the bottom O of that
new distribution and draw another trend line. The first Bullish
Support line will always serve to be the long-term trend line
and may very well come into play years later. These shorter term
trend lines serve as visual guides for you. The short-term trend
lines can also be valuable to the trader in identifying the direction
of stocks. Traders often initiate a long trade when the stock
has declined near the Bullish Support Line because the stock
is then close to the stop-loss point. The most important characteristic
of the Point and Figure method is its clear guidelines for entering
and exiting a trade. One of the keys to successful investing
is avoiding the big hit. These guidelines will help you do that.
|